Macroautophagy--a novel Beta-amyloid peptide-generating pathway activated in Alzheimer's disease - PubMed (original) (raw)
. 2005 Oct 10;171(1):87-98.
doi: 10.1083/jcb.200505082. Epub 2005 Oct 3.
Ana Maria Cuervo, Asok Kumar, Corrinne M Peterhoff, Stephen D Schmidt, Ju-Hyun Lee, Panaiyur S Mohan, Marc Mercken, Mark R Farmery, Lars O Tjernberg, Ying Jiang, Karen Duff, Yasuo Uchiyama, Jan Näslund, Paul M Mathews, Anne M Cataldo, Ralph A Nixon
Affiliations
- PMID: 16203860
- PMCID: PMC2171227
- DOI: 10.1083/jcb.200505082
Macroautophagy--a novel Beta-amyloid peptide-generating pathway activated in Alzheimer's disease
W Haung Yu et al. J Cell Biol. 2005.
Abstract
Macroautophagy, which is a lysosomal pathway for the turnover of organelles and long-lived proteins, is a key determinant of cell survival and longevity. In this study, we show that neuronal macroautophagy is induced early in Alzheimer's disease (AD) and before beta-amyloid (Abeta) deposits extracellularly in the presenilin (PS) 1/Abeta precursor protein (APP) mouse model of beta-amyloidosis. Subsequently, autophagosomes and late autophagic vacuoles (AVs) accumulate markedly in dystrophic dendrites, implying an impaired maturation of AVs to lysosomes. Immunolabeling identifies AVs in the brain as a major reservoir of intracellular Abeta. Purified AVs contain APP and beta-cleaved APP and are highly enriched in PS1, nicastrin, and PS-dependent gamma-secretase activity. Inducing or inhibiting macroautophagy in neuronal and nonneuronal cells by modulating mammalian target of rapamycin kinase elicits parallel changes in AV proliferation and Abeta production. Our results, therefore, link beta-amyloidogenic and cell survival pathways through macroautophagy, which is activated and is abnormal in AD.
Figures
Figure 1.
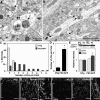
Increased macroautophagy in PS1/APP mice and human brains. (A–D) EM images of cortical neuropil show an absence of AVs and normal neurite profile in 9-mo-old NTg mouse brains (A, arrowheads outline normal neurites) and a marked accumulation of AVs within enlarged or dystrophic neurites in PS1/APP mice (B, arrowheads outline dystrophic neurite profiles in C) and biopsied brain material from an AD patient (B, inset). At higher magnification (C), AVs include autophagosomes (arrows) and multilamellar bodies (arrowhead). In normal dendrites of PS1/APP mice, multiple AVs are frequently seen (D, arrows). (E and F) LC3 quantification analyzed from immunoblots of LC3-I and LC3-II (top) in prefrontal cortical homogenates from cases of nonaffected (Cont), early stage (preclinical) AD (AD-ES), and moderate AD (AD-MS; E), and from brains of 18–22-mo-old PS1/APP (PA) mice (n = 3; F) compared with nontransgenic (NTg) controls (n = 3; *, P < 0.01). Error bars represent SEM. (G–L) LC3 immunofluorescence in 9-mo-old PS1/APP mice can be seen mainly as puncta in dystrophic dendrites of the cortex (G, arrows) and along adjacent dendrites. LC3 (H, arrows) is strong in dystrophic neurites in the periphery (asterisks) of a thioflavin S–labeled plaque core (H, inset) but is less so in neurites closest (H, arrowheads) to the Aβ deposit. LC3 is diffuse and uniform in neurons of NTg mice (I and J) but is predominantly vesicular and distributed more to the dendrites (arrows) than the cell soma (arrowheads) in 9-mo-old PS1/APP cortex (K and L).
Figure 2.
Identification of macroautophagy in the hippocampus of predepositing PS1/APP mice. Ultrastructural inspection of brain tissue from PS1/APP mice (A–D) shows that AVs (A and B, arrows) are five times more frequent in the dendrites of 8-wk-old PS1/APP than in those of age-matched NTg mice. The frequency of AVs per EM field (C) and mean number of AVs per EM field (D) within the hippocampal molecular layer (n = 3) are shown. LC3 immunoblot and analysis (E) and immunofluorescent labeling (F–K) of the hippocampal dendrites (brackets) in 8–9-wk-old PS1/APP and NTg mice show LC3-II elevation (P < 0.05) in 8-wk-old PS1/APP compared with NTg mice (E). (D) *, P < 0.001. (E) *, P < 0.05. Error bars represent SEM. LC3 immunoreactivity in pyramidal cell dendrites is increased in 9-mo-old (F–H) and 9-wk-old (I–K) PS1/APP mice and frequently exhibits a punctate labeling pattern, which is more evident at 9 mo than at 9 wk (H and K, arrows) and is uncommon in NTg mice (F and I). Bars (F, G, I, and J), 20 μm; (H and K), 10 μm.
Figure 3.
Immunolocalization of PS1 in plaques and AVs within dystrophic neurites in AD and PS1/APP mice. Cingulate cortex from 9-mo-old PS1/APP mice immunolabeled with PS1 antibody and NT1 showed that PS1 localized to plaques (A). At higher magnification, anti-PS1 antibodies strongly labeled neuritic profiles that were distributed within the plaque corona (B). PS1 immunoreactivity is identified by IEM in AVs within dystrophic neurites of PS1/APP animals (C and D) and human brain (E and F) by IEM. Arrowheads identify tubulovesicular membrane labeling. PS1 (C–F, arrows) was localized on the outer limiting membrane of the AV but not in mitochondria (Mito) or on plasma membranes (PM). IEM followed by silver stain enhancement for PS1 was performed on a human brain that was diagnosed for AD (F).
Figure 4.
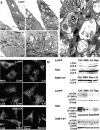
Induction of macroautophagy in L/APP, SH-SY5Y, and N2a cells. (A and B) EM images showing changes in the number of AVs (arrows) in L/APP-overexpressing APP695 (L/APP cells) grown in complete medium (A, top left) or in medium lacking Leu and His (A, top right) for 6 h and in SH-SY5Y cells grown in the presence (A, bottom left) or absence (A, bottom right) of serum. At higher magnification, early and late AVs with typical morphologies are seen in a Leu/His-deprived L/APP cell (B). (C) Fluorescent and immunofluorescent labeling of large vesicles by the AV marker monodansylcadaverine (0.5 μg/ml for 30 min; left) and LC3 antibody (middle, L/APP; right, SH-SY5Y) in macroautophagy-induced cells (bottom), which are much less abundant in cells grown in complete medium (top). (D) Western blots confirm the cytochemical evidence for increased LC3-II levels as well as phospho-mTOR (P-2481) but not total mTOR after macroautophagy induction by Leu and His deprivation or 10 nM rapamycin (Rap) and macroautophagy inhibition by 5 mM 3MA in L/APP, N2a, and SH-SY5Y cells. Immunoblots for LC3 in SH-SY5Y cells and P-2481 mTOR in L/APP cells have been spliced but are derived from the same blot.
Figure 5.
Aβ generation in cells after autophagic modulation. Levels of Aβ40 (A), Aβ42 (B), βCTF (C), and APP (D) measured by sandwich ELISA after the incubation of L/APP cells (6 h) in conditions that block autophagy (+Leu, +His, +Leu/+His, and 5 mM 3MA), activate macroautophagy (−Leu, −His, −Leu/−His, and rapamycin), or do not affect autophagy (complete media and enrichment of the deprivation of Gly or Val). Values reported as percent difference of control ± SEM; *, P < 0.05 (at least). In similar experiments, Aβ40 and Aβ42 levels from SH-SY5Y (E and F) and N2a cells (G and H) after various treatments. Error bars represent SEM.
Figure 6.
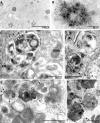
Immunolocalization of Aβ in AVs from L/APP cells and PS1/APP brains and γ-secretase components (PS1 and nicastrin) in L/APP cells. Immunogold localization of Aβ40 (A), Aβ42 (B), PS1 (C), nicastrin (D), and in the absence of primary antibody (E) in L/APP cells grown for 6 h in the absence of Leu and His. (F) Quantification of gold particle frequency in AV or tubulovesicular compartments (TBV), which comprise 27.0 ± 11.0 and 19.2 ± 7.2%, respectively, of the total cell area. Error bars represent SEM. (G and H) IEM followed by silver stain enhancement for Aβ40 was performed in 9-mo-old PS1/APP mice.
Figure 7.
Evidence for the enrichment of PS1-dependent γ-secretase activity in AVs. (A and B) Ultrastructure of AVs (A1 and A2) and lysosomes in subcellular fractions from serum-deprived L/APP cells (A) and Western blot analysis (B) for LC3-II, rab24, APP, βCTF, PS1 (PS1 amino-terminal fragment), and nicastrin (NCT) in L/APP subcellular fractions. AVs, A1 and A2; L, lysosomes; E, tubulovesicular compartments (Golgi/ER/endosomes); P, postnuclear pellet; C, cytosol; M, mitochondria. Empty lanes in the original blot have been removed from the figure and noted with a white line. (C) Rates of cleavage of the fluorogenic substrate in subcellular fractions from L/APP cells grown in −serum media (left) or −Leu/−His media (right). PNP, postnuclear pellet. (D and E) Proportions of the total recovered cell γ-secretase activity in different subcellular fractions after serum deprivation (D) or in uninduced (+serum) or induced (−Leu/−His) cells (E). Comparison of +serum versus −Leu and −His conditions shows the redistribution of γ-secretase activity from the tubulovesicular to AV fractions after macroautophagic induction. G, Golgi; A, AV. (F) Liquid chromatography mass spectrometry analysis of the fluorogenic substrate after incubation with purified AVs. Selected ion chromatogram corresponding to different cleavage products is displayed. Numbers in graph refer to the cleavage/amino acid site from the Aβ peptide. (G) γ-Secretase activity in AV and lysosome fractions from mice blastocysts in which the PS1 and PS2 genes were deleted (PS KO; BD8) or in which human PS1 was stably transfected into the PS KO blastocysts (hPS1; BD8/hPS1). Numbers on x axis are in minutes. (H) Aβ40 and Aβ42 levels in medium from these cells as detected by sandwich ELISA. Values are given as means ± SEM (error bars).
Figure 8.
Proposed models of AV accumulation leading to elevated Aβ levels. The schematic of macroautophagy depicts (A) the usual progression from autophagosomes (AP) to autophagolysosomes (APL) to lysosomes (L). Conditions that result in AV buildup (B and C) are expected to promote Aβ generation and accumulation, including impaired or delayed maturation of autophagosomes to lysosomes (B) or acute maximum induction of macroautophagy (C). Within neurons, AVs normally progress to lysosomes efficiently and are rarely seen in neurons (D). In AD, the disrupted retrograde transport of AVs in dendrites represents one of several possible mechanisms that impede the maturation of AVs to lysosomes, leading to Aβ generation in AVs and its delayed degradation in lysosomes (E).
Comment in
- A(beta) generation in autophagic vacuoles.
Mizushima N. Mizushima N. J Cell Biol. 2005 Oct 10;171(1):15-7. doi: 10.1083/jcb.200508097. J Cell Biol. 2005. PMID: 16216920 Free PMC article. Review.
Similar articles
- Autophagic vacuoles are enriched in amyloid precursor protein-secretase activities: implications for beta-amyloid peptide over-production and localization in Alzheimer's disease.
Yu WH, Kumar A, Peterhoff C, Shapiro Kulnane L, Uchiyama Y, Lamb BT, Cuervo AM, Nixon RA. Yu WH, et al. Int J Biochem Cell Biol. 2004 Dec;36(12):2531-40. doi: 10.1016/j.biocel.2004.05.010. Int J Biochem Cell Biol. 2004. PMID: 15325590 - Genes and mechanisms involved in beta-amyloid generation and Alzheimer's disease.
Steiner H, Capell A, Leimer U, Haass C. Steiner H, et al. Eur Arch Psychiatry Clin Neurosci. 1999;249(6):266-70. doi: 10.1007/s004060050098. Eur Arch Psychiatry Clin Neurosci. 1999. PMID: 10653281 Review. - Presenilin-1, nicastrin, amyloid precursor protein, and gamma-secretase activity are co-localized in the lysosomal membrane.
Pasternak SH, Bagshaw RD, Guiral M, Zhang S, Ackerley CA, Pak BJ, Callahan JW, Mahuran DJ. Pasternak SH, et al. J Biol Chem. 2003 Jul 18;278(29):26687-94. doi: 10.1074/jbc.m304009200. Epub 2003 May 7. J Biol Chem. 2003. PMID: 12736250 - Proteolytic processing of the Alzheimer's disease amyloid precursor protein in brain and platelets.
Evin G, Zhu A, Holsinger RM, Masters CL, Li QX. Evin G, et al. J Neurosci Res. 2003 Nov 1;74(3):386-92. doi: 10.1002/jnr.10745. J Neurosci Res. 2003. PMID: 14598315 - Alzheimer's disease.
De-Paula VJ, Radanovic M, Diniz BS, Forlenza OV. De-Paula VJ, et al. Subcell Biochem. 2012;65:329-52. doi: 10.1007/978-94-007-5416-4_14. Subcell Biochem. 2012. PMID: 23225010 Review.
Cited by
- Clinical and Market Analysis of NanoBEO: A Public-Worth, Innovative Therapy for Behavioral and Psychological Symptoms of Dementia (BPSD)-Emerging Evidence and Its Implications for a Health Technology Assessment (HTA) and Decision-Making in National Health Systems.
Scuteri D, Pierobon D, Pagliaro M, Hamamura K, Hayashi T, Pignolo L, Nicotera P, Bagetta G, Corasaniti MT. Scuteri D, et al. Pharmaceutics. 2024 Sep 27;16(10):1253. doi: 10.3390/pharmaceutics16101253. Pharmaceutics. 2024. PMID: 39458585 Free PMC article. - Acquisition of neurodegenerative features in isogenic OPTN(E50K) human stem cell-derived retinal ganglion cells associated with autophagy disruption and mTORC1 signaling reduction.
Huang KC, Gomes C, Shiga Y, Belforte N, VanderWall KB, Lavekar SS, Fligor CM, Harkin J, Hetzer SM, Patil SV, Di Polo A, Meyer JS. Huang KC, et al. Acta Neuropathol Commun. 2024 Oct 18;12(1):164. doi: 10.1186/s40478-024-01872-2. Acta Neuropathol Commun. 2024. PMID: 39425218 Free PMC article. - HLH-30/TFEB modulates autophagy to improve proteostasis in Aβ transgenic Caenorhabditis elegans.
Lin H, Zhang C, Gao Y, Zhou Y, Ma B, Jiang J, Long X, Yimamu N, Zhong K, Li Y, Cui X, Wang H. Lin H, et al. Front Pharmacol. 2024 Aug 30;15:1433030. doi: 10.3389/fphar.2024.1433030. eCollection 2024. Front Pharmacol. 2024. PMID: 39281281 Free PMC article. - Acarbose ameliorates Western diet-induced metabolic and cognitive impairments in the 3xTg mouse model of Alzheimer's disease.
Sonsalla MM, Babygirija R, Johnson M, Cai S, Cole M, Yeh CY, Grunow I, Liu Y, Vertein D, Calubag MF, Trautman ME, Green CL, Rigby MJ, Puglielli L, Lamming DW. Sonsalla MM, et al. Geroscience. 2024 Sep 14. doi: 10.1007/s11357-024-01337-3. Online ahead of print. Geroscience. 2024. PMID: 39271570 - Recent advances in Alzheimer's disease: Mechanisms, clinical trials and new drug development strategies.
Zhang J, Zhang Y, Wang J, Xia Y, Zhang J, Chen L. Zhang J, et al. Signal Transduct Target Ther. 2024 Aug 23;9(1):211. doi: 10.1038/s41392-024-01911-3. Signal Transduct Target Ther. 2024. PMID: 39174535 Free PMC article. Review.
References
- Asanuma, K., I. Tanida, I. Shirato, T. Ueno, H. Takahara, T. Nishitani, E. Kominami, and Y. Tomino. 2003. MAP-LC3, a promising autophagosomal marker, is processed during the differentiation and recovery of podocytes from PAN nephrosis. FASEB J. 17:1165–1167. - PubMed
- Askanas, V., W.K. Engel, C.C. Yang, R.B. Alvarez, V.M. Lee, and T. Wisniewski. 1998. Light and electron microscopic immunolocalization of presenilin 1 in abnormal muscle fibers of patients with sporadic inclusion-body myositis and autosomal-recessive inclusion-body myopathy. Am. J. Pathol. 152:889–895. - PMC - PubMed
- Bendiske, J., and B.A. Bahr. 2003. Lysosomal activation is a compensatory response against protein accumulation and associated synaptopathogenesis-an approach for slowing Alzheimer disease? J. Neuropathol. Exp. Neurol. 62:451–463. - PubMed
- Biederbick, A., H.F. Kern, and H.P. Elsasser. 1995. Monodansylcadaverine (MDC) is a specific in vivo marker for autophagic vacuoles. Eur. J. Cell Biol. 66:3–14. - PubMed
- Billings, L.M., S. Oddo, K.N. Green, J.L. McGaugh, and F.M. Laferla. 2005. Intraneuronal Aβ causes the onset of early Alzheimer's disease-related cognitive deficits in transgenic mice. Neuron. 45:675–688. - PubMed
Publication types
MeSH terms
Substances
Grants and funding
- R01 AG021904/AG/NIA NIH HHS/United States
- R37 AG021904/AG/NIA NIH HHS/United States
- AG17617-05/AG/NIA NIH HHS/United States
- P01 AG017617/AG/NIA NIH HHS/United States
- AG021904/AG/NIA NIH HHS/United States
LinkOut - more resources
Full Text Sources
Other Literature Sources
Medical
Molecular Biology Databases


