How defects in central tolerance impinge on a deficiency in regulatory T cells - PubMed (original) (raw)
Comparative Study
. 2005 Oct 11;102(41):14735-40.
doi: 10.1073/pnas.0507014102. Epub 2005 Oct 3.
Affiliations
- PMID: 16203996
- PMCID: PMC1253589
- DOI: 10.1073/pnas.0507014102
Comparative Study
How defects in central tolerance impinge on a deficiency in regulatory T cells
Zhibin Chen et al. Proc Natl Acad Sci U S A. 2005.
Abstract
Both central (thymic) and peripheral (nonthymic) mechanisms are important for the induction and maintenance of T cell tolerance. Mice with a defect in Foxp3, required for the generation and activity of CD4(+)CD25(+) regulatory T cells, exhibit massive lymphoproliferation and severe inflammatory infiltration of multiple organs, in particular the lungs, liver, and skin. We have explored how this phenotype is influenced by an additional defect in central tolerance induction, generated by either crossing in a null mutation of the Aire gene or substituting the nonobese diabetic (NOD) genetic background. The double-deficient mice had fulminant autoimmunity in very early life and a gravely shortened lifespan vis-à-vis single-deficient littermates. They showed massive lymphoproliferation and exacerbated inflammatory damage, particularly in the lungs and liver. Yet, the range of affected sites was not noticeably extended, and, surprisingly, many organs, or regions of organs, remained untouched, suggesting additional important mechanisms to enforce immunological self-tolerance.
Figures
Fig. 1.
A gravely shortened lifespan in mice deficient in both central and peripheral tolerance. Survival rates of normal, Aireo/o, Foxp3 sf/+Aireo/o, Foxp3sf, Foxp3sfAire+/o and Foxp3sfAireo/o mice on either the B6 (Left) or NOD (Right) genetic background (n = 5-7 for each group).
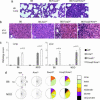
Fig. 2.
Histopathology. (a) H&E sections of the lungs from 9-day-old mice on the B6 background, showing accelerated inflammatory infiltration in the lungs of Foxp3sfAireo/o mice. (Original magnification: ×200.) (b) H&E sections of the liver from 14-day-old mice on the B6 background, showing exacerbated inflammatory damage in Foxp3sfAireo/o mice. (Original magnification: ×200.) (c) Pathology score of the lungs and liver of mice on the B6 or NOD background. (d) A summary of histological surveys of 2-wk-old mice: 1, lung; 2, liver; 3, skin; 4, pancreas; 5, kidney; 6, fat; 7, muscle; 8, stomach; 9, colon; and 10, noninfiltrated organs including the central nervous system, the joints, the lachrymal, salivary, prostate, adrenal, thyroid, and parathyroid glands, the eye, and the small intestine (n = 3-6, with the lower _n_s representing WT and Aireo/o mice).
Fig. 3.
Absence of significant tissue damage in the small intestine despite massive lymphoproliferation in the Peyer's patch (PP). Sections of the small intestine from 2-wk-old mice were stained with H&E. Only a portion of the Peyer's patch is shown. Note the intact intestinal villi and glands adjacent to the hyperproliferative Peyer's patch in Foxp3sf and Foxp3sfAireo/o mice. Data are representative of 4-6 mice in each group on either the B6 or NOD background. (Original magnification: ×100.)
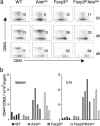
Fig. 4.
T cell activation in Foxp3sfAireo/o mice was not further increased over that in Foxp3sf animals. The lymphoid organs of 3-day-, 6-day- or 9-day-old mice were analyzed by flow cytometry for activated T cells identified as CD44hiCD62Llo. (a) Similar frequencies of activated T cells in the spleen of Foxp3sf and Foxp3sfAireo/o mice. The number in the plot is the percentage of gated cells in the CD4+ subset. Patterns also reflect CD8+ T cells. Data are from 2-4 mice in each group on either the B6 or NOD background. (b) Total numbers of CD4+CD44hiCD62Llo in the spleen and inguinal lymph nodes (ILN) of 9-day-old mice. Each bar represents one animal.
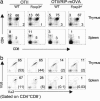
Fig. 5.
No role of Foxp3 in clonal deletion of autoreactive T cells. Flow cytometric analyses of the thymus and spleen of the OTII TCR transgenic mice, with or without the cognate antigen expressed by the RIP-mOVA transgene, in the presence or absence of Foxp3. (a) CD4 and CD8 profiles in the lymphoid gate. (b) The clonotypic Vα2+Vβ5+ expression by CD4+CD8- cells. Numbers in plots indicate the percentage of the gated clonotypehi T cells, and numbers in parentheses are the average total number (× 105) of the gated cells per organ. Data represent two experiments. Each group had two to four mice between 2 and 3 wk of age.
Similar articles
- Medullary thymic epithelial cells and CD8α+ dendritic cells coordinately regulate central tolerance but CD8α+ cells are dispensable for thymic regulatory T cell production.
Herbin O, Bonito AJ, Jeong S, Weinstein EG, Rahman AH, Xiong H, Merad M, Alexandropoulos K. Herbin O, et al. J Autoimmun. 2016 Dec;75:141-149. doi: 10.1016/j.jaut.2016.08.002. Epub 2016 Aug 16. J Autoimmun. 2016. PMID: 27543048 Free PMC article. - Thymus-derived regulatory T cells contribute to tolerance to commensal microbiota.
Cebula A, Seweryn M, Rempala GA, Pabla SS, McIndoe RA, Denning TL, Bry L, Kraj P, Kisielow P, Ignatowicz L. Cebula A, et al. Nature. 2013 May 9;497(7448):258-62. doi: 10.1038/nature12079. Epub 2013 Apr 28. Nature. 2013. PMID: 23624374 Free PMC article. - Defective selection of thymic regulatory T cells accompanies autoimmunity and pulmonary infiltrates in Tcra-deficient mice double transgenic for human La/Sjögren's syndrome-B and human La-specific TCR.
Yaciuk JC, Pan Y, Schwarz K, Pan ZJ, Maier-Moore JS, Kosanke SD, Lawrence C, Farris AD. Yaciuk JC, et al. J Immunol. 2015 Feb 15;194(4):1514-22. doi: 10.4049/jimmunol.1400319. Epub 2015 Jan 12. J Immunol. 2015. PMID: 25582858 Free PMC article. - Guarding the immune system: suppression of autoimmunity by CD4+CD25+ immunoregulatory T cells.
Zwar TD, van Driel IR, Gleeson PA. Zwar TD, et al. Immunol Cell Biol. 2006 Dec;84(6):487-501. doi: 10.1111/j.1440-1711.2006.01471.x. Epub 2006 Sep 5. Immunol Cell Biol. 2006. PMID: 16956386 Review. - Central tolerance to self revealed by the autoimmune regulator.
Chan AY, Anderson MS. Chan AY, et al. Ann N Y Acad Sci. 2015 Nov;1356(1):80-9. doi: 10.1111/nyas.12960. Ann N Y Acad Sci. 2015. PMID: 26579596 Free PMC article. Review.
Cited by
- Type 1 Diabetes: A Chronic Anti-Self-Inflammatory Response.
Clark M, Kroger CJ, Tisch RM. Clark M, et al. Front Immunol. 2017 Dec 22;8:1898. doi: 10.3389/fimmu.2017.01898. eCollection 2017. Front Immunol. 2017. PMID: 29312356 Free PMC article. Review. - Breakdown in peripheral tolerance in type 1 diabetes in mice and humans.
Jeker LT, Bour-Jordan H, Bluestone JA. Jeker LT, et al. Cold Spring Harb Perspect Med. 2012 Mar;2(3):a007807. doi: 10.1101/cshperspect.a007807. Cold Spring Harb Perspect Med. 2012. PMID: 22393537 Free PMC article. Review. - Immune tolerance induction by integrating innate and adaptive immune regulators.
Suzuki J, Ricordi C, Chen Z. Suzuki J, et al. Cell Transplant. 2010;19(3):253-68. doi: 10.3727/096368909X480314. Epub 2009 Nov 16. Cell Transplant. 2010. PMID: 19919733 Free PMC article. Review. - Following the fate of one insulin-reactive CD4 T cell: conversion into Teffs and Tregs in the periphery controls diabetes in NOD mice.
Fousteri G, Jasinski J, Dave A, Nakayama M, Pagni P, Lambolez F, Juntti T, Sarikonda G, Cheng Y, Croft M, Cheroutre H, Eisenbarth G, von Herrath M. Fousteri G, et al. Diabetes. 2012 May;61(5):1169-79. doi: 10.2337/db11-0671. Epub 2012 Mar 8. Diabetes. 2012. PMID: 22403296 Free PMC article. - The dynamics of effector T cells and Foxp3+ regulatory T cells in the promotion and regulation of autoimmune encephalomyelitis.
Korn T, Anderson AC, Bettelli E, Oukka M. Korn T, et al. J Neuroimmunol. 2007 Nov;191(1-2):51-60. doi: 10.1016/j.jneuroim.2007.09.009. Epub 2007 Oct 3. J Neuroimmunol. 2007. PMID: 17916388 Free PMC article. Review.
References
- Mathis, D. & Benoist, C. s004) Immunity 20, 509-516. - PubMed
- Sakaguchi, S. (2004) Annu. Rev. Immunol. 22, 531-562. - PubMed
- Ohashi, P. S. (2003) Curr. Opin. Immunol. 15, 668-676. - PubMed
- Venanzi, E. S., Benoist, C. & Mathis, D. (2004) Curr. Opin. Immunol. 16, 197-202. - PubMed
- Bjorses, P., Aaltonen, J., Horelli-Kuitunen, N., Yaspo, M. L. & Peltonen, L. (1998) Hum. Mol. Genet. 7, 1547-1553. - PubMed
Publication types
MeSH terms
Substances
LinkOut - more resources
Full Text Sources
Other Literature Sources
Molecular Biology Databases
Research Materials


