Erythropoietin stimulates phosphorylation and activation of GATA-1 via the PI3-kinase/AKT signaling pathway - PubMed (original) (raw)
Erythropoietin stimulates phosphorylation and activation of GATA-1 via the PI3-kinase/AKT signaling pathway
Wei Zhao et al. Blood. 2006.
Abstract
Erythropoietin (Epo) stimulation of its receptor's downstream signaling pathways and optimum function of GATA-1 transcription factor are both essential for normal erythroid cell development. Epo-receptor (EpoR) signaling and GATA-1 regulate proliferation, survival, differentiation, and maturation of erythroid cells. Whether any signal that is generated by EpoR targets GATA-1 or affects GATA-1 transcriptional activity is not known. Here, we demonstrate that stimulation of EpoR results in phosphorylation of GATA-1 at serine 310 (S310) in primary fetal liver erythroid progenitors and in cultured erythroid cells. We show that phosphorylation of GATA-1 is important for Epo-induced maturation of fetal liver erythroid progenitor cells. The PI3-kinase/AKT signaling pathway is identified as a mediator of Epo-induced phosphorylation of GATA-1. AKT serine threonine kinase phosphorylates GATA-1S310 in vitro and in erythroid cells and enhances GATA-1 transcriptional activity. These data demonstrate that EpoR signaling phosphorylates GATA-1 and modulates its activity via the PI3-kinase/AKT signaling pathway.
Figures
Figure 1.
Putative AKT consensus phosphorylation site in GATA-1. (A-B) Alignment of the C-terminal zinc finger domain of GATA family of transcription factors. Highly conserved putative AKT consensus phosphorylation sequence surrounding S310 in hematopoietic GATAs (A) and among different species (B) are highlighted in black. Conserved cysteine residues in the C-terminal zinc finger domain are highlighted in gray. Arrow shows the highly conserved serine residue. (C) Schematic of wild-type (WT) GATA-1 protein. The serine (S) to alanine (A), aspartic acid (D), glutamic acid (E), and alanine to serine mutations in GATA-1 constructs are indicated. Nuclear localization sequence (NLS).
Figure 2.
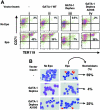
Phosphorylation of GATA-1 is required for fetal liver erythroid cell differentiation. (A) TER 119- fetal liver progenitor cells were transduced with an empty retroviral vector (MIG) or vectors containing the indicated inserts and cultured in the presence or absence of Epo; 36 hours later live GFP+ cells were examined for expression of red cell differentiation markers, percentages of CD71+TER 119+ differentiated cells (top right quadrant) in the absence or presence of Epo are shown. Representative of at least 3 independent experiments. (B) Representative field of Wright-Giemsa staining of live GFP+ cells (× 1000) and of differential count: the percentage of highly mature erythroblasts (normoblasts shown by arrows) formed in Epo-stimulated cultures in indicated GFP+-transduced cell populations is shown. Images were captured with a Nikon E600 microscope (Garden City, NJ) with a 100×/0.3 numeric aperture oil immersion lens and an RT slider SPOT 2.3.1 camera (Diagnostic Instuments, Sterling Heights, MI) using SPOT advanced software (version 3.5.9).
Figure 3.
GATA-1S310 is phosphorylated in response to Epo stimulation of primary fetal liver and cultured erythroid cells. (A) Western blot analysis of nuclear extracts of MEL cells induced to differentiate in the presence or absence of 5 mM HMBA after 96 hours using anti-GATA1 (pS310), anti-GATA1 (N6), or anti-topoisomerase I (Topo I) antibodies (i). Benzidine staining of hemoglobin (ii) confirmed the undifferentiated and differentiated status of MEL cells used (i). (B-C) The Epo-dependent erythroleukemic HCD57 cells were Epo-starved overnight, and 5 × 10⁷ cells were stimulated with Epo (2 U/mL) for the indicated time points, in the presence or absence of inhibitors of PI3-kinase LY294002 (LY; 10 μM), Wortmannin (WO; 100 nM), inhibitor of ERK/MAP kinase PD98059 (PD; 50 μM), or inhibitor of p38 MAP kinase SB203580 (SB; 10 μM). Western blot analysis of nuclear extracts with the indicated antibodies. (D) Cells (from B-C) were stimulated with increasing doses of Epo for 1 hour, and nuclear extracts were subjected to Western blot analysis as in panel B. Results shown are representative of at least 3 independent experiments. (E) Fetal liver cells enriched for erythroid progenitors (TER 119- cells) were starved overnight in vitro in serum-free media (SFEM; StemCell Technologies) in the presence of SF (50 ng/mL) and IL-6 (10 ng/mL) and stimulated or not with Epo (2 U/mL) for 2 hours. Nuclear extracts were subjected to Western blot analysis as in panel B.
Figure 4.
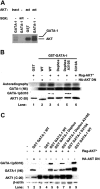
Activated AKT phosphorylates GATA-1S310. Purified recombinant constitutively active AKT (act), kinase inactive AKT (inact), or constitutively active SGK protein (act) (A) or immunocomplexes of Flag-tagged constitutively active AKT (AKT*) or HA-tagged kinase-inactive mutant of AKT (AKT K-D) (B) were used in an in vitro kinase assay and incubated in the presence of [γ-32P]ATP with GST-GATA-1 WT or mutants as substrates. Samples were resolved on SDS-PAGE, and 32P-labeled proteins were detected by autoradiography (A-B). Half of the reaction was subjected to Western blot analysis using the indicated antibodies (B). (C) 293T cells were cotransfected with GST alone or GST-GATA-1 wild type or mutants and a Flag-tagged constitutively active AKT (AKT*) or a dominant-negative AKT (HA-AKT DN), lysates were prepared 48 hours later and subjected to Western blot analysis by using the indicated antibodies.
Figure 5.
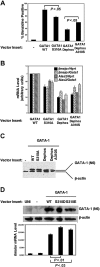
Phosphorylation enhances GATA-1 transactivation activity. (A) GATA-1-deficient G1E cells were transduced with an empty retroviral vector (MIG) alone or vectors containing the indicated inserts, and 48 hours later the differentiation was analyzed by diaminobenzidine staining of hemoglobin in total cells in the absence of cell sorting. Results are expressed as percentages of positive control GATA-1 WT-transduced cells. P values determined by Student t test (GATA-1S310A versus wild type, n = 6; GATA-1 A310S versus Dephos, n = 3). (B) Real-time PCR analysis of gene expression in total cells from panel A. Results shown are normalized to both Gata1 and Hprt mRNA expression. (C) Western blot analysis of GATA-1 protein expression in G1E cells after 48 hours of retroviral transduction. (D) Experiments performed as in panel A, using GATA-1 phosphomimetic mutants to transduce G1E cells cultured in 0.1 U/mL Epo. Real-time PCR analysis, representative Western blot analysis of GATA-1 mutant protein expression in transduced G1E cells. UNT indicates untransduced. In panels A, B, and D, values shown are mean ± SEM.
Figure 6.
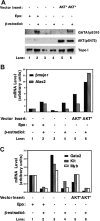
Activated AKT phosphorylates and enhances GATA-1 transactivation activity in erythroid cells. (A) G1E-R2H cells were retrovirally transduced with an empty vector (MIG) or MIG-AKT* and cultured in the presence or absence of Epo for 16 hours before adding β-estradiol (10-7 M). Nuclear extracts were prepared 7 hours later and subjected to Western blot analysis using the indicated antibodies. Total RNA was prepared from an aliquot of cells from panel A and subjected to real-time PCR for analysis of genes whose expression is up-regulated (B) or repressed (C) by nuclear GATA-1. Representative graphs from 3 independent experiments are shown.
Figure 7.
AKT and GATA-1 synergize in up-regulating red cell gene expression in G1E cells. GATA-1 and constitutively active AKT* were retrovirally transduced in G1E cells in the absence of Epo; 24 hours later, cells were FACS sorted and cultured for another 24 hours before preparing RNA for real-time PCR analysis (top) and protein for Western blot analysis (bottom) using the indicated antibodies. One of 2 independent experiments is shown.
Similar articles
- AKT induces erythroid-cell maturation of JAK2-deficient fetal liver progenitor cells and is required for Epo regulation of erythroid-cell differentiation.
Ghaffari S, Kitidis C, Zhao W, Marinkovic D, Fleming MD, Luo B, Marszalek J, Lodish HF. Ghaffari S, et al. Blood. 2006 Mar 1;107(5):1888-91. doi: 10.1182/blood-2005-06-2304. Epub 2005 Oct 27. Blood. 2006. PMID: 16254141 Free PMC article. - Critical role for PI 3-kinase in the control of erythropoietin-induced erythroid progenitor proliferation.
Bouscary D, Pene F, Claessens YE, Muller O, Chrétien S, Fontenay-Roupie M, Gisselbrecht S, Mayeux P, Lacombe C. Bouscary D, et al. Blood. 2003 May 1;101(9):3436-43. doi: 10.1182/blood-2002-07-2332. Epub 2002 Dec 27. Blood. 2003. PMID: 12506011 - Lnk inhibits erythropoiesis and Epo-dependent JAK2 activation and downstream signaling pathways.
Tong W, Zhang J, Lodish HF. Tong W, et al. Blood. 2005 Jun 15;105(12):4604-12. doi: 10.1182/blood-2004-10-4093. Epub 2005 Feb 10. Blood. 2005. PMID: 15705783 Free PMC article. - The role of tyrosine phosphorylation in proliferation and maturation of erythroid progenitor cells--signals emanating from the erythropoietin receptor.
Klingmüller U. Klingmüller U. Eur J Biochem. 1997 Nov 1;249(3):637-47. doi: 10.1111/j.1432-1033.1997.t01-1-00637.x. Eur J Biochem. 1997. PMID: 9395308 Review. - STAT5 as a Key Protein of Erythropoietin Signalization.
Tóthová Z, Tomc J, Debeljak N, Solár P. Tóthová Z, et al. Int J Mol Sci. 2021 Jul 1;22(13):7109. doi: 10.3390/ijms22137109. Int J Mol Sci. 2021. PMID: 34281163 Free PMC article. Review.
Cited by
- Sumoylation regulates interaction of FOG1 with C-terminal-binding protein (CTBP).
Snow JW, Kim J, Currie CR, Xu J, Orkin SH. Snow JW, et al. J Biol Chem. 2010 Sep 3;285(36):28064-75. doi: 10.1074/jbc.M109.096909. Epub 2010 Jun 28. J Biol Chem. 2010. PMID: 20587419 Free PMC article. - An R307H substitution in GATA1 that prevents Ser310 phosphorylation causes severe fetal anemia.
Hetzer B, Meryk A, Kropshofer G, Bargehr C, Jimenez-Heredia R, Boztug K, Mühlegger BE, Dworzak M, Gruber T, Crazzolara R. Hetzer B, et al. Blood Adv. 2022 Jul 26;6(14):4330-4334. doi: 10.1182/bloodadvances.2021006347. Blood Adv. 2022. PMID: 35580337 Free PMC article. No abstract available. - MicroRNAs in the pathophysiology of Alzheimer's disease and Parkinson's disease: an overview.
Khezri MR, Yousefi K, Zolbanin NM, Ghasemnejad-Berenji M. Khezri MR, et al. Mol Neurobiol. 2022 Mar;59(3):1589-1603. doi: 10.1007/s12035-022-02727-4. Epub 2022 Jan 9. Mol Neurobiol. 2022. PMID: 35001356 Review. - A Systems Approach Identifies Essential FOXO3 Functions at Key Steps of Terminal Erythropoiesis.
Liang R, Campreciós G, Kou Y, McGrath K, Nowak R, Catherman S, Bigarella CL, Rimmelé P, Zhang X, Gnanapragasam MN, Bieker JJ, Papatsenko D, Ma'ayan A, Bresnick E, Fowler V, Palis J, Ghaffari S. Liang R, et al. PLoS Genet. 2015 Oct 9;11(10):e1005526. doi: 10.1371/journal.pgen.1005526. eCollection 2015 Oct. PLoS Genet. 2015. PMID: 26452208 Free PMC article. - Protection of insect neurons by erythropoietin/CRLF3-mediated regulation of pro-apoptotic acetylcholinesterase.
Knorr DY, Schneider K, Büschgens L, Förster J, Georges NS, Geurten BRH, Heinrich R. Knorr DY, et al. Sci Rep. 2022 Nov 3;12(1):18565. doi: 10.1038/s41598-022-22035-0. Sci Rep. 2022. PMID: 36329181 Free PMC article.
References
- Wu H, Liu X, Jaenisch R, Lodish HF. Generation of committed erythroid BFU-E and CFU-E progenitors does not require erythropoietin or the erythropoietin receptor. Cell. 1995;83: 59-67. - PubMed
- Lin CS, Lim SK, D'Agati V, Costantini F. Differential effects of an erythropoietin receptor gene disruption on primitive and definitive erythropoiesis. Genes Dev. 1996;10: 154-164. - PubMed
- Ghaffari S, Huang LJS, Zhang J, Lodish HF. Erythropoietin receptor signaling processes. In: Molineux G, Foote MA, Elliott SG, eds. Erythropoietins and Erythropoiesis. Basel, Switzerland: Birkhauser; 2003.
- Socolovsky M, Fallon AE, Lodish HF. The prolactin receptor rescues EpoR-/- erythroid progenitors and replaces EpoR in a synergistic interaction with c-kit. Blood. 1998;92: 1491-1496. - PubMed
Publication types
MeSH terms
Substances
LinkOut - more resources
Full Text Sources
Other Literature Sources
Research Materials


