Reward encoding in the monkey anterior cingulate cortex - PubMed (original) (raw)
Reward encoding in the monkey anterior cingulate cortex
C Amiez et al. Cereb Cortex. 2006 Jul.
Abstract
The anterior cingulate cortex (ACC) is known to play a crucial role in the fast adaptations of behavior based on immediate reward values. What is less certain is whether the ACC is also involved in long-term adaptations to situations with uncertain outcomes. To study this issue, we placed macaque monkeys in a probabilistic context in which the appropriate strategy to maximize reward was to identify the stimulus with the highest reward value (optimal stimulus). Only knowledge of the theoretical average reward value associated with this stimulus--referred to as 'the task value'--was available. Remarkably, in each trial, ACC pre-reward activity correlated with the task value. Importantly, this neuronal activity was observed prior to the discovery of the optimal stimulus. We hypothesize that the received rewards and the task value, constructed a priori through learning, are used to guide behavior and identify the optimal stimulus. We tested this hypothesis by muscimol deactivation of the ACC. As predicted, this inactivation impaired the search for the optimal stimulus. We propose that ACC participates in long-term adaptation of voluntary reward-based behaviors by encoding general task values and received rewards.
Figures
Fig. 1A–C
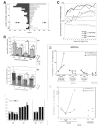
A. Display monitor. Location of the two target positions. A 2 × 2 cm square located 10 cm below either one (randomly, 50/50) of the two targets served as starting position (SP) of the hand (in this figure, the left SP is represented). B. Trial events in the choice task. Grey areas correspond to the time of illumination of the starting position (SP) and of the target stimuli. E1 to E6: epochs for analysis. C. Location of task-related cells. Abbreviations: CC, corpus callosum; ArS, rostral extent of the superior branch of the arcuate sulcus; Ars, arcuate sulcus; end of SP, caudal extent of the Sulcus Principalis; SGm, medial superior gyrus; Cgd and Cgv, dorsal and ventral banks of cingulate sulcus; CgG, cingulate gyrus.
Fig. 2A–F. Behavioral data in the choice task
A. Population histogram of search sizes (in number of trials) for a sample of tests performed by the two monkeys (M1: n=197, M2 n=189). B. Global strategy of keep and change during the search period. Histograms show the absolute total number of cases in which a choice on “A” or “B” (current) was preceded by a choice on A that led to a large reward (AL), by a choice on A that led to a small reward (AS), etc. C. Large-keep and small-keep strategies during tests. In ordinates, the percent of trials using these strategies. The plots are aligned on the second trial of tests. D. Performance of the model in the choice task measured at different stages, compared to monkeys’ performance(on the right). E. Performance of the model measured for different reference values, compared to monkeys’ performance (on the right). F. Movement times (MT) and reaction times (RT) measured for the two monkeys in the different tasks (control 1.2ml, Choice task (C), control 0.4ml, and control 0ml), and during the two periods of the Choice task (Search: SEA and repetition: REP).
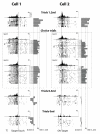
Fig. 3. Activity of two ACC cells during performance of the NO-choice task and two tests in the choice task
Each raster line displays cell activity recorded during one trial. Time scale is indicated below the last raster on the left. Activity scales are indicated, for each cell. Rasters and histograms are aligned on the target touch (Cell 1) and on onset of the target-stimuli (Cell 2). At the right of each raster line, activity in epoch E4 (between the GO-signal and the touch in Cell 1) and in epoch E2 (1 second after onset of the stimuli in Cell 2) are represented along the abscissa on the normalized scale 0–100. In the choice trials, the horizontal solid line “R” in the middle of rasters indicates the beginning of the repetition period. “A” or “B” and “0.4ml” or “1.2ml” at right of each raster line indicates the identity of the touched stimulus and the reward obtained. (The sequence of “A” and “B” is used to construct the performance curve; “A”=1, and “B”=0. cf.fig.6A). In cell 1, the activity in the choice task (around 70) was statistically different from the activity in trial 1.2ml (Test1 : Z=2.21, p < 0.027; Test2 : Z=1.92, p < 0.05, Mann-Whitney U test) and in trial 0.4ml (Test1 : Z=−3.46, p < 0.0005; Test2 : Z=−3.25, p < 0.001). In cell 2, the activity in the repetition of the choice task (around 70) was statistically different from the activity in trial 1.2ml (Test1: Z=3.26, p < 0.001; Test2 : Z=3.04, p < 0.002) and in trial 0.4ml (Test1: Z=−3.25, p < 0.001; Test2 : Z=−3.25, p < 0.001). In both cells, similar patterns of activity were observed in the repetition period of tests (Test1 vs Test2 in Cell 1: F(1,19)=1.42; p<0.249; Test1 vs Test2 in Cell 2: F(1,18)=0.10; p<0.757, ANOVA). In cell 1, no statistical change of discharge between the 3 first trials and the 5 last trials was observed (Test 1: Z=1.93, ns, Test 2: Z=1.93, ns).
Fig. 4. Activity of an ACC cell responding to reward delivery in the NO-choice trials 1.2ml and 0.4ml and population data
A : Neuronal discharges are aligned on reward delivery. The data show that activity of the cell is modulated by the reward amount in the NO-choice trials 1.2 and 0.4ml (F(1,66)=32,89, p <10−6, ANOVA). B and C : Population data. Normalized post-reward activity in trials 0.4ml, 1.2ml and choice trials. B : 13 epochs in 13 cells; Group 1.2 ? 0.4 ? 0. The average activity in the choice trials when the current reward obtained is 1.2 ml and 0.4 ml is 103.4 and 18.6, respectively. C: 48 epochs in 48 cells; Group (1.2 = 0.4) ? 0. In C and D, the post-reward activity in both search and repetition periods of choice tests are pooled. The triangle represents trials in which the reward obtained was 0.4 ml (i.e. in the NO-choice trials 0.4 ml and in the choice trials in which 0.4 ml was obtained). The circle represents trials in which the reward obtained was 1.2 ml (i.e. in the NO-choice trials 1.2 ml and in the choice trials in which 1.2 ml was obtained). The average activity in the choice trials when the current reward obtained is 1.2 ml and 0.4 ml is 96 and 98.4, respectively.”
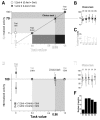
Fig. 5A–F. Population data. Normalized pre-reward activity in trials 0ml, 0.4ml, 1.2ml and choice trial
Task values are in abscissa. Data points in ordinates are the normalized average activities of epochs (m ± sd) (There is no error-bar for trial 1.2ml and trial 0.4ml, which are equal, in each epoch, to 100 and 0, respectively -see methods). Data are from 4 groups of epochs defined in Table 1 (?,✦, ? and ■). A: 115 epochs in 57 cells; Group 1.2 ? 0.4 ? 0 (✦, line 2 in table 1) and group 1.2 ? (0.4 = 0) (?, line 3 in table). The average activity in the choice trials is 68.6 and 67.9, resp. In B and C are detailed the epochs considered in A, with their average value and number. D: 271 epochs in 133 cells; Group (1.2 = 0.4) > 0 (?, line 5 in table 1) and group (1.2 = 0.4) < 0 (■, line 6 in table) The average activity in the choice trials is 95.1 and 104.3, resp. In E and F are detailed the epochs considered in D, with their average value and number.
Fig. 6A–D. Correlation analysis between performance and activity
A. Activity curve and performance curve (Data are from Cell 2, Test 2 in Fig.3). B. Example of correlation analysis between performance and activity (from data in A). Peak correlation (r = 0.7), significant at p<0.05, at lag +1. The positive lag indicates an advance of the activity over the performance. C. Population data. Intervals 11 to 15. Distribution of significant peak correlation coefficients in the two monkeys. D. Population data. Distribution of lags for the peak correlations. Positive lags are more numerous than negative lags (χ2=17.42, p<10−4, Mac Nemar).
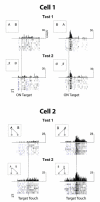
Fig. 7. Spatial selectivity of ACC neurons
Cell 1 and cell 2 were recorded in the left and right ACC of M1, during the repetition in 2 tests. Positions of letters “A” and “B” in the insets designate the position of the optimal and non-optimal stimulus. Cell 1 is more active when the optimal stimulus is located on the right (Left vs Right, epoch E2: F(1,22)=867.9, p<10−6. Cell 2 is more active when the arm-movements are directed towards the right position (Left vs Right, epoch E4: F(1,31)=239.65, p< 10−6).
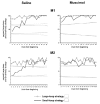
Fig. 8. Evolution of the performance in the choice task after unilateral (UNI) and bilateral (Bl) muscimol injections in the ACC
In abscissa, Period1: 0–15min after the last muscimol injection; Period2: 15–30min; Period3: 30–45min; Period4: 45–60min. In ordinates: percents of tests in which the good stimulus is discovered. The saline results in the 4 periods are pooled. Data are from 70 saline, 87 UNI-muscimol, and 25 BI-muscimol choice tests. The data show a deficit in the muscimol sessions during the first 45mn. Difference at _p <_ 0.001 (**) and at _p_<0.0001 (***). During period1 and period2 following unilateral and bilateral muscimol injections, performance is at chance level (50%) (Period 1: UNI: ns at _p_>0.897, BI: ns at _p_>0.636; Period 2: UNI: ns at _p_>0. 667, BI: ns at _p_>0. 636)..
Fig. 9. A–B. Usage frequency of the “large-keep” and “small-keep” strategies in the choice trials, in the saline and muscimol sessions
A. In the saline sessions, the usage frequency of the small-keep and large keep strategies in both monkeys are similar to those observed during the electrophysiological recordings (in Fig. 2C). B. In the muscimol sessions, the usage frequency of the strategy “ small-keep” at the beginning of tests is higher than in the saline sessions. Comparison of the 4 first trials in monkey 1 (χ2=7.6, p<0.006), and of the 8 first trials in monkey 2 (χ2=7.7, p<0.005). The usage frequency of the strategy “large-keep” is the same in the muscimol and in the saline sessions in M1 (χ2=0.01, ns at p<0.05), and in M2 (χ2=0.02, ns). These data indicate that, in the muscimol sessions, the “large-keep” or “small-keep” strategies are prevalent in all trials. The strategy of the animal is “keep”. (Dotted lines: confidence limits (at p<0.05) of the null hypothesis, i.e. no strategy, random choices).
Similar articles
- Neuronal activity of the anterior cingulate cortex during an observation-based decision making task in monkeys.
de Araujo MF, Hori E, Maior RS, Tomaz C, Ono T, Nishijo H. de Araujo MF, et al. Behav Brain Res. 2012 Apr 21;230(1):48-61. doi: 10.1016/j.bbr.2012.01.060. Epub 2012 Feb 7. Behav Brain Res. 2012. PMID: 22342487 - Individual Neurons in the Cingulate Cortex Encode Action Monitoring, Not Selection, during Adaptive Decision-Making.
Li YS, Nassar MR, Kable JW, Gold JI. Li YS, et al. J Neurosci. 2019 Aug 21;39(34):6668-6683. doi: 10.1523/JNEUROSCI.0159-19.2019. Epub 2019 Jun 19. J Neurosci. 2019. PMID: 31217329 Free PMC article. - Distinct portions of anterior cingulate cortex and medial prefrontal cortex are activated by reward processing in separable phases of decision-making cognition.
Rogers RD, Ramnani N, Mackay C, Wilson JL, Jezzard P, Carter CS, Smith SM. Rogers RD, et al. Biol Psychiatry. 2004 Mar 15;55(6):594-602. doi: 10.1016/j.biopsych.2003.11.012. Biol Psychiatry. 2004. PMID: 15013828 - Contrasting reward signals in the orbitofrontal cortex and anterior cingulate cortex.
Wallis JD, Kennerley SW. Wallis JD, et al. Ann N Y Acad Sci. 2011 Dec;1239:33-42. doi: 10.1111/j.1749-6632.2011.06277.x. Ann N Y Acad Sci. 2011. PMID: 22145873 Review. - Molecular mechanisms of pain in the anterior cingulate cortex.
Zhuo M. Zhuo M. J Neurosci Res. 2006 Oct;84(5):927-33. doi: 10.1002/jnr.21003. J Neurosci Res. 2006. PMID: 16862566 Review.
Cited by
- Neural populations in macaque anterior cingulate cortex encode social image identities.
Simon Iv J, Rich EL. Simon Iv J, et al. Nat Commun. 2024 Aug 29;15(1):7500. doi: 10.1038/s41467-024-51825-5. Nat Commun. 2024. PMID: 39209844 Free PMC article. - What can neuroimaging of neuromodulation reveal about the basis of circuit therapies for psychiatry?
Fujimoto S, Fujimoto A, Elorette C, Choi KS, Mayberg H, Russ B, Rudebeck P. Fujimoto S, et al. Neuropsychopharmacology. 2024 Nov;50(1):184-195. doi: 10.1038/s41386-024-01976-2. Epub 2024 Aug 28. Neuropsychopharmacology. 2024. PMID: 39198580 Review. - Neural activity ramps in frontal cortex signal extended motivation during learning.
Regalado JM, Corredera Asensio A, Haunold T, Toader AC, Li YR, Neal LA, Rajasethupathy P. Regalado JM, et al. Elife. 2024 Jul 22;13:RP93983. doi: 10.7554/eLife.93983. Elife. 2024. PMID: 39037775 Free PMC article. - Anterior Cingulate Cortex Causally Supports Meta-Learning.
Treuting RL, Boroujeni KB, Gerrity CG, Tiesinga P, Womelsdorf T. Treuting RL, et al. bioRxiv [Preprint]. 2024 Jun 13:2024.06.12.598723. doi: 10.1101/2024.06.12.598723. bioRxiv. 2024. PMID: 38915609 Free PMC article. Preprint. - Neural activity ramps in frontal cortex signal extended motivation during learning.
Regalado JM, Asensio AC, Haunold T, Toader AC, Li YR, Neal LA, Rajasethupathy P. Regalado JM, et al. bioRxiv [Preprint]. 2024 Apr 20:2023.10.15.562395. doi: 10.1101/2023.10.15.562395. bioRxiv. 2024. PMID: 37905153 Free PMC article. Updated. Preprint.
References
- Akkal D, Bioulac B, Audin J, Burbaud P. Comparison of neuronal activity in the rostral supplementary and cingulate motor areas during a task with cognitive and motor demands. Eur J Neurosci. 2002;15:887–904. - PubMed
- Botvinick MM, Braver TS, Barch DM, Carter CS, Cohen JD. Conflict monitoring and cognitive control. Psychol Rev. 2001;108:624–652. - PubMed
- Fiorillo CD, Tobler PN, Schultz W. Discrete coding of reward probability and uncertainty by dopamine neurons. Science. 2003;299(5614):1898–1902. - PubMed
Publication types
MeSH terms
LinkOut - more resources
Full Text Sources
Research Materials

