A likelihood ratio test for species membership based on DNA sequence data - PubMed (original) (raw)
Comparative Study
A likelihood ratio test for species membership based on DNA sequence data
Mikhail V Matz et al. Philos Trans R Soc Lond B Biol Sci. 2005.
Abstract
DNA barcoding as an approach for species identification is rapidly increasing in popularity. However, it remains unclear which statistical procedures should accompany the technique to provide a measure of uncertainty. Here we describe a likelihood ratio test which can be used to test if a sampled sequence is a member of an a priori specified species. We investigate the performance of the test using coalescence simulations, as well as using the real data from butterflies and frogs representing two kinds of challenge for DNA barcoding: extremely low and extremely high levels of sequence variability.
Figures
Figure 1
(a) Frequencies of likelihood ratios in the test applied to sequence data simulated using different values of θ per locus, for different number of database sequences. Horizontal axis, value of likelihood ratio test statistic; vertical axis, number of replicates out of 100. (b) Summary of the results from panel A.
Figure 2
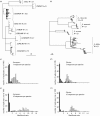
Consensus maximum parsimony trees for cox1 sequences from the two real data sets: (a) skipper butterfly Astraptes fulgerator species complex, and (b) four species of the tree frogs of the genus Litoria. Scale bars: 10 nucleotide changes. The number of individual sequences per species is indicates near the species names. (c–f): frequency distributions of the likelihood ratio test statistic in simulations with these datasets. The number of sequences used to represent a true or sister species in the test was either 3 (c, d) or 10 (e, f). Filled bars, test with correct species to assess type I error rate; open bars, test with sister species to assess type II error rate.
Figure 3
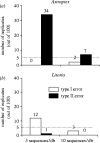
Summary of error rates obtained for Astraptes (a) and Litoria (b) datasets with different number of sequences per species in the database, assuming the critical value of 2.7. Open bars, type I error rate; filled bars, type II error rate.
Similar articles
- Statistical approaches for DNA barcoding.
Nielsen R, Matz M. Nielsen R, et al. Syst Biol. 2006 Feb;55(1):162-9. doi: 10.1080/10635150500431239. Syst Biol. 2006. PMID: 16507534 No abstract available. - Estimating sample sizes for DNA barcoding.
Zhang AB, He LJ, Crozier RH, Muster C, Zhu CD. Zhang AB, et al. Mol Phylogenet Evol. 2010 Mar;54(3):1035-9. doi: 10.1016/j.ympev.2009.09.014. Epub 2009 Sep 15. Mol Phylogenet Evol. 2010. PMID: 19761856 - A likelihood framework for estimating phylogeographic history on a continuous landscape.
Lemmon AR, Lemmon EM. Lemmon AR, et al. Syst Biol. 2008 Aug;57(4):544-61. doi: 10.1080/10635150802304761. Syst Biol. 2008. PMID: 18686193 - High mitochondrial diversity in geographically widespread butterflies of Madagascar: a test of the DNA barcoding approach.
Linares MC, Soto-Calderón ID, Lees DC, Anthony NM. Linares MC, et al. Mol Phylogenet Evol. 2009 Mar;50(3):485-95. doi: 10.1016/j.ympev.2008.11.008. Epub 2008 Nov 21. Mol Phylogenet Evol. 2009. PMID: 19056502
Cited by
- DNA BARCODING IN LAND PLANTS: DEVELOPING STANDARDS TO QUANTIFY AND MAXIMIZE SUCCESS.
Erickson DL, Spouge J, Resch A, Weigt LA, Kress WJ. Erickson DL, et al. Taxon. 2008 Nov 1;57(4):1304-1316. Taxon. 2008. PMID: 19779570 Free PMC article. - DNA barcode sequence identification incorporating taxonomic hierarchy and within taxon variability.
Little DP. Little DP. PLoS One. 2011;6(8):e20552. doi: 10.1371/journal.pone.0020552. Epub 2011 Aug 16. PLoS One. 2011. PMID: 21857897 Free PMC article. - A Measure of the DNA Barcode Gap for Applied and Basic Research.
Phillips JD, Griswold CK, Young RG, Hubert N, Hanner RH. Phillips JD, et al. Methods Mol Biol. 2024;2744:375-390. doi: 10.1007/978-1-0716-3581-0_24. Methods Mol Biol. 2024. PMID: 38683332 - Things fall apart: biological species form unconnected parsimony networks.
Hart MW, Sunday J. Hart MW, et al. Biol Lett. 2007 Oct 22;3(5):509-12. doi: 10.1098/rsbl.2007.0307. Biol Lett. 2007. PMID: 17650475 Free PMC article. - DNA barcode analysis: a comparison of phylogenetic and statistical classification methods.
Austerlitz F, David O, Schaeffer B, Bleakley K, Olteanu M, Leblois R, Veuille M, Laredo C. Austerlitz F, et al. BMC Bioinformatics. 2009 Nov 10;10 Suppl 14(Suppl 14):S10. doi: 10.1186/1471-2105-10-S14-S10. BMC Bioinformatics. 2009. PMID: 19900297 Free PMC article.
References
- Cornuet J.M, Aulagnier S, Lek S, Franck P, Solignac M. Classifying individuals among infra-specific taxa using microsatellite data and neural networks. C. R. Acad. Sci. Paris. Life Sci. 1996;319:1167–1177. - PubMed
Publication types
MeSH terms
LinkOut - more resources
Full Text Sources


