Distinct enzyme combinations in AKAP signalling complexes permit functional diversity - PubMed (original) (raw)
Distinct enzyme combinations in AKAP signalling complexes permit functional diversity
Naoto Hoshi et al. Nat Cell Biol. 2005 Nov.
Abstract
Specificity in cell signalling can be influenced by the targeting of different enzyme combinations to substrates. The A-kinase anchoring protein AKAP79/150 is a multivalent scaffolding protein that coordinates the subcellular localization of second-messenger-regulated enzymes, such as protein kinase A, protein kinase C and protein phosphatase 2B. We developed a new strategy that combines RNA interference of the endogenous protein with a protocol that selects cells that have been rescued with AKAP79/150 forms that are unable to anchor selected enzymes. Using this approach, we show that AKAP79/150 coordinates different enzyme combinations to modulate the activity of two distinct neuronal ion channels: AMPA-type glutamate receptors and M-type potassium channels. Utilization of distinct enzyme combinations in this manner provides a means to expand the repertoire of cellular events that the same AKAP modulates.
Figures
Figure 1
RNA interference of AKAP79 in HEK293 cells. (a) Immunoblot showing AKAP79 (top panel) and tubulin (loading control, middle panel) expression levels in cell lysates from cells transfected with control or pSAKAP79i plasmids (indicated above lanes). The time (days) post-transfection is indicated above each lane. (Bottom panel) AKAP79 expression levels from control (black circles) and gene-silenced (red circles) cells were quantified by densitometry from immunoblots using an NIH image. Amalgamated data from five experiments is presented. (b) Flowchart depicting the selection protocol used to isolate CD4/pSAKAP79i double-positive cells and green fluorescent protein (GFP) cells expressing modified AKAP forms and ion-channels. (c) Characterization of AKAP79 knockdown and rescue with recombinant AKAP150 in CD4/pSAKAP79i double-positive cells (lane 2). Immunoblot detection of AKAP79 (top panel), recombinant AKAP150 (middle panel) and tubulin (bottom panel) in cell lysates is shown. The reciprocol experiment with AKAP150 knockdown in CD4/pSAKAP150i double-positive cells and rescue with recombinant AKAP79 is shown in lane 3. (d) Electrophysiological recording of recombinant GluR1 channels time course from control (black triangles, n = 8), _AKAP79_-silenced (red circles, n = 9) and CD4/pSAKAP79i double-positive cells expressing recombinant AKAP150 (AKAP150 rescue, green squares, n = 12). Normalized GluR1 currents (relative to time 0, 1 mM glutamate) over a time course of 10 min are presented. The PKA inhibitor PKI was included in the pipette solution. (e) Representative traces at time 0 and 5 min after the first application of 1 mM glutamate are presented. A representative trace from an additional control group of cells transfected with the pSAKAP150i construct specific for the murine orthologue is shown (n = 6). (f) Amalgamated data depicting the level of normalized current for all experimental groups taken 5 min after the application of agonist. The statistical significance of electrophysiology data shown in this figure, part f, was calculated using one-way ANOVA followed by two-tailed Student's _t_-test. Statistical significance of control versus pSAKAP79i is P = 0.0050 and of pSAKAP79i + AKAP150 rescue versus pSAKAP79i is P = 0.0050. Error bars indicate SEM.
Figure 2
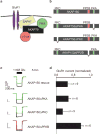
PP2B is a fundamental component of the GluR1–AKAP79/150 signalling network in HEK293 cells. (a) Diagram depicting a proposed configuration of the GluR1–AKAP signalling network. (b) Schematic representation of AKAP150 deletion mutants lacking enzyme-binding sites for protein kinase A (PKA; green), protein kinase C (PKC; blue) or protein phosphatase 2B (PP2B; red) used to reconstitute modified GluR1–AKAP signalling networks. (c) Representative traces at time 0 and 5 min after the initial application of 1 mM glutamate and (d) amalgamated data depicting the level of normalized current for each experimental group taken 5 min after the application of agonist (n values are indicted). The PKA inhibitor PKI was included in the pipette solution. The statistical significance of electrophysiology data shown in this figure, part d, was calculated using one-way ANOVA followed by two-tailed Student's _t_-test. Statistical significance of AKAP150ΔPP2B rescue versus AKAP150 rescue is P = 0.0090. Error bars indicate SEM.
Figure 3
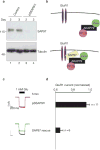
RNA interference of SAP97 in HEK293 cells. (a) Plasmid-based RNA interference knockdown of the adapter protein SAP97. (Top panel) Immunoblot detection of SAP97 and (Bottom panel) immunoblot detection of tubulin in lysates from control and pSSAP97i-transfected cells 2 and 3 d after transfection. (b) Schematic representation depicting the disruption of the GluR1–AKAP79 signalling network following removal of SAP97. (c) Representative traces at time 0 and 5 min after the application of 1 mM glutamate and (d) amalgamated data depicting the level of normalized current for each experimental group taken 5 min after the application of agonist. The protein kinase A (PKA) inhibitor PKI was included in the pipette solution. (e) Schematic depicting the reformation of the GluR1–AKAP79 signalling network following the expression of rat SAP97. The statistical significance of electrophysiology data shown in this figure, part d, was calculated using one-way ANOVA followed by two-tailed Student's _t_-test. Statistical significance of SAP97 rescue versus pSSAP97i knockdown is P = 0.00011. Error bars indicate SEM.
Figure 4
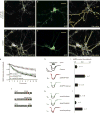
Modulation of AMPA channels with modified AKAP complexes. Gene silencing of AKAP150 was achieved by electroporation of cultured hippocampal neurons with the pSAKAP150i plasmid. (a, d) Immunofluorescent detection of AKAP150; (b, e) fluorescent detection of green fluorescent protein (GFP); (c, f) composite images of AKAP150 and the outline of GFP-positive cells in cultured hippocampal neurons transfected with pSAKAP150i or a control plasmid. Fluorescent emission from GFP and anti-AKAP150 labelled with Cy5-conjugated secondary antibodies was detected using a confocal microscope (scale bar, 20 μm). (g) Whole-cell electrophysiological recording of AMPA currents in control (black diamonds, n = 11), _AKAP150_-silenced (red triangles, n = 7) or AKAP79-rescued (green circles, n = 8) neurons. The protein kinase A (PKA) inhibitor PKI was included in the pipette solution. Time courses of normalized AMPA currents are presented for 0–10 min after the application of 100 μM glutamate. (h) Representative traces at time 0 and 5 min after the application of 100 μM glutamate. (i) Amalgamated data depicting the level of normalized current for each experimental group taken 5 min after the application of agonist. (j) Diagram of AKAP79 deletion mutants lacking enzyme-binding sites for PKA (green), protein kinase C (PKC; blue) or protein phosphatase 2B (PP2B; red) used to reconstitute modified signalling complexes in _AKAP150_-silenced neurons. (k) Representative traces at time 0 and 5 min after the application of 100 μM glutamate and (l) amalgamated data depicting the level of normalized current for each experimental group taken 5 min after the application of agonist (n values are indicted). The statistical significance of electrophysiology data shown in this figure, parts i and l, was calculated using one-way ANOVA followed by two-tailed Student's _t_-test. Statistical significance of pSAKAP150i versus control is P = 0.000093, and of AKAP79ΔPP2B rescue versus AKAP79 rescue is P = 0.018. Error bars indicate SEM.
Figure 5
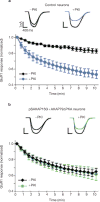
PKA activation is required for maintaining AMPA currents. (a) Whole-cell electrophysiological recording of AMPA currents in control hippocampal neurons without (−PKI, n = 5, black diamonds) and with (+PKI, n = 7, blue circles) PKI (10 μM) in the pipette solution. Time courses of normalized AMPA currents are presented for 0–10 min after the application of 100 μM glutamate. Representative traces from both −PKI (black) and +PKI (blue) at time 0 and 5 min after the application of 100 μM glutamate. (b) Similar recordings of AMPA currents in _AKAP150_-silenced and AKAP79(ΔPKA)-rescued neurons (−PKI, n = 9, black diamonds; +PKI, n = 5, green circles).
Figure 6
AKAP150 facilitates selective M-current suppression. (a) Schematic diagram of receptor-mediated G-protein-coupled pathways that modulate M channels. (b) Muscarinic suppression of M channels in dissociated superior cervical ganglion (SCG) neurons. The muscarinic agonist oxotremorine-M (Oxo-M; 1 μM) was applied through the flow pipette for 1 min. Whole-cell electrophysiological recording was continued for another 4 min in control (black circles, n = 8), _AKAP150_-silenced (red circles, n = 12) and AKAP79-rescued (green squares, n = 6) SCG neurons. (c) Representative traces at time 0 and 1 min after the application of 1 μM Oxo-M and (d) amalgamated data depicting the level of normalized current 1 min after the application of agonist are presented for each experimental group. An additional control group of cells transfected with the pSAKAP79i construct specific for the human orthologue is also shown (n = 10). (e) M currents recorded from control (black circles, n = 7) and _AKAP150_-silenced (red squares, n = 9) neurons following Oxo-M (1 μM) treatment. After a recovery period of 10 min, a second agonist, bradykinin (100 nM), was applied to the same cells. Representative traces from control (top) and _AKAP150_-silenced (below) neurons at time zero and 1 min after the application of Oxo-M (left inset) and bradykinin (right inset). (f) AKAP150 and the m1 muscarinic receptor interact. HEK293 cells were co-transfected with plasmids encoding AKAP150 and HA-tagged m1 muscarinic receptor or HA-tagged B2 bradykinin receptor, followed by immunoprecipitation with monoclonal antibodies against the HA epitope tag. (Top panel) Immunoblot detection of AKAP150 and (middle panel) immunoblot detection of HA-tagged receptors present in immune complexes isolated with anti-HA. (Bottom panel) Shows immunoblot detection of AKAP150 presence in cell lysates. The statistical significance of electrophysiology data shown in this figure, part d, was calculated using one-way ANOVA followed by two-tailed Student's _t_-test. Statistical significance of pSAKAP150i versus control is P = 0.00021. Error bars indicate SEM.
Figure 7
Functional dissection of an M-channel–AKAP complex. (a) Schematic diagram of AKAP79 deletion mutants and fragments used in functional rescue experiments. Enzyme binding sites for protein kinase C (PKC; blue), protein phosphatase 2B (PP2B; red) and protein kinase A (PKA; green) are indicated. (b) Representative traces at time 0 and 1 min after the application of 10 μM Oxo-M and (c) amalgamated data depicting the level of normalized current for each experimental group taken 1 min after the application of agonist. Summary diagrams depicting the functionally relevant components required for (d) muscarinic suppression of M channels in superior cervical ganglion neurons and (e) glutamate-mediated downregulation of AMPA channels in hippocampal neurons. The statistical significance of electrophysiology data shown in part c was calculated using one-way ANOVA followed by two-tailed Student's _t_-test. Statistical significance of pSAKAP150i versus control is P = 0.0000047, AKAP79ΔPKC versus AKAP79 rescue is P = 0.0022, AKAP79 aa 1–153 + kinase-dead PKC versus AKAP79 rescue is P = 0.00069, AKAP79 aa 100–427 versus AKAP79 rescue is P = 0.0058. Error bars indicate SEM.
Comment in
- A-kinase anchoring proteins: different partners, different dance.
Chen L, Kass RS. Chen L, et al. Nat Cell Biol. 2005 Nov;7(11):1050-1. doi: 10.1038/ncb1105-1050. Nat Cell Biol. 2005. PMID: 16385733 No abstract available.
Similar articles
- Contextual utilization of enzymes in discrete AKAP79/150 signalling complexes.
Hoshi N, Scott JD. Hoshi N, et al. Eur J Cell Biol. 2006 Jul;85(7):621-2. doi: 10.1016/j.ejcb.2006.01.004. Epub 2006 Feb 7. Eur J Cell Biol. 2006. PMID: 16460836 - Imaging kinase--AKAP79--phosphatase scaffold complexes at the plasma membrane in living cells using FRET microscopy.
Oliveria SF, Gomez LL, Dell'Acqua ML. Oliveria SF, et al. J Cell Biol. 2003 Jan 6;160(1):101-12. doi: 10.1083/jcb.200209127. Epub 2002 Dec 30. J Cell Biol. 2003. PMID: 12507994 Free PMC article. - Mapping the protein phosphatase-2B anchoring site on AKAP79. Binding and inhibition of phosphatase activity are mediated by residues 315-360.
Dell'Acqua ML, Dodge KL, Tavalin SJ, Scott JD. Dell'Acqua ML, et al. J Biol Chem. 2002 Dec 13;277(50):48796-802. doi: 10.1074/jbc.M207833200. Epub 2002 Sep 26. J Biol Chem. 2002. PMID: 12354762 Free PMC article. - Regulation of ion channels by cAMP-dependent protein kinase and A-kinase anchoring proteins.
Gray PC, Scott JD, Catterall WA. Gray PC, et al. Curr Opin Neurobiol. 1998 Jun;8(3):330-4. doi: 10.1016/s0959-4388(98)80057-3. Curr Opin Neurobiol. 1998. PMID: 9687361 Review. - The where's and when's of kinase anchoring.
Smith FD, Langeberg LK, Scott JD. Smith FD, et al. Trends Biochem Sci. 2006 Jun;31(6):316-23. doi: 10.1016/j.tibs.2006.04.009. Epub 2006 May 11. Trends Biochem Sci. 2006. PMID: 16690317 Review.
Cited by
- Adrenergic regulation of HCN4 channel requires protein association with β2-adrenergic receptor.
Greene D, Kang S, Kosenko A, Hoshi N. Greene D, et al. J Biol Chem. 2012 Jul 6;287(28):23690-7. doi: 10.1074/jbc.M112.366955. Epub 2012 May 21. J Biol Chem. 2012. PMID: 22613709 Free PMC article. - Somatosensory scaffolding structures.
Jeske NA. Jeske NA. Front Mol Neurosci. 2012 Jan 23;5:2. doi: 10.3389/fnmol.2012.00002. eCollection 2012. Front Mol Neurosci. 2012. PMID: 22291616 Free PMC article. - Ca2+/calmodulin disrupts AKAP79/150 interactions with KCNQ (M-Type) K+ channels.
Bal M, Zhang J, Hernandez CC, Zaika O, Shapiro MS. Bal M, et al. J Neurosci. 2010 Feb 10;30(6):2311-23. doi: 10.1523/JNEUROSCI.5175-09.2010. J Neurosci. 2010. PMID: 20147557 Free PMC article. - The PKARIalpha subunit of protein kinase A modulates the activation of p90RSK1 and its function.
Chaturvedi D, Cohen MS, Taunton J, Patel TB. Chaturvedi D, et al. J Biol Chem. 2009 Aug 28;284(35):23670-81. doi: 10.1074/jbc.M109.032813. Epub 2009 Jul 1. J Biol Chem. 2009. PMID: 19570980 Free PMC article. - AKAP79/150 impacts intrinsic excitability of hippocampal neurons through phospho-regulation of A-type K+ channel trafficking.
Lin L, Sun W, Kung F, Dell'Acqua ML, Hoffman DA. Lin L, et al. J Neurosci. 2011 Jan 26;31(4):1323-32. doi: 10.1523/JNEUROSCI.5383-10.2011. J Neurosci. 2011. PMID: 21273417 Free PMC article.
References
- Venter JC, et al. The sequence of the human genome. Science. 2001;291:1304–1351. - PubMed
- Lander ES, et al. Initial sequencing and analysis of the human genome. Nature. 2001;409:860–921. - PubMed
- Hunter T. Signaling — 2000 and beyond. Cell. 2000;100:113–127. - PubMed
- Pawson T, Nash P. Assembly of cell regulatory systems through protein interaction domains. Science. 2003;300:445–452. - PubMed
- Wong W, Scott JD. AKAP signalling complexes: Focal points in space and time. Nature Rev Mol Cell Biol. 2004;5:959–971. - PubMed
Publication types
MeSH terms
Substances
LinkOut - more resources
Full Text Sources


