PIP2 activates TRPV5 and releases its inhibition by intracellular Mg2+ - PubMed (original) (raw)
PIP2 activates TRPV5 and releases its inhibition by intracellular Mg2+
Jason Lee et al. J Gen Physiol. 2005 Nov.
Abstract
The transient receptor potential type V5 channel (TRPV5) is a Ca2+-selective TRP channel important for epithelial Ca2+ transport. Intracellular Mg2+ causes a fast voltage-dependent block of the TRPV5 channel by binding to the selectivity filter. Here, we report that intracellular Mg2+ binding to the selectivity filter of TRPV5 also causes a slower reversible conformational change leading to channel closure. We further report that PIP2 activates TRPV5. Activation of TRPV5 by PIP2 is independent of Mg2+. Yet, PIP2 decreases sensitivity of the channel to the Mg2+-induced slow inhibition. Mutation of aspartate-542, a critical Mg2+-binding site in the selectivity filter, abolishes Mg2+-induced slow inhibition. PIP2 has no effects on Mg2+-induced voltage-dependent block. Thus, PIP2 prevents the Mg2+-induced conformational change without affecting Mg2+ binding to the selectivity filter. Hydrolysis of PIP2 via receptor activation of phospholipase C sensitizes TRPV5 to the Mg2+-induced slow inhibition. These results provide a novel mechanism for regulation of TRP channels by phospholipase C-activating hormones via alteration of the sensitivity to intracellular Mg2+.
Figures
Figure 1.
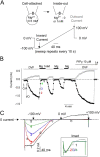
Multiple effects of intracellular Mg2+ on TRPV5. (A) Configuration and voltage protocol of recording. Voltage stimuli were applied every 10 s. Black and gray arrows indicate time points when inward and outward currents shown in Fig. 1 B were taken, respectively. (B) Intracellular Mg2+ causes a fast reversible voltage-dependent block, a slow reversible inhibition, and an irreversible run-down of TRPV5 in inside-out membranes. See text for details. Inside-out patches were bathed in either DVF or 1 mM Mg2+-containing solution. C/A and I/O indicate cell-attached and inside-out. Application of PIP2 and 1 mM La3+ (La) in DVF solution are indicated. Time interval between data points (shown in circles) is 10 s. As described previously by us (Yeh et al., 2003, 2005), expression of TRPV5 in CHO cells is robust. We estimated that under our experimental condition each excised patch contains ∼50–150 channels. PIP2 reactivated run-down TRPV5 channels (i.e., currents recovered to >50% of the level before run-down) in 54 out of 62 recordings. We did not observe significant background currents in inside-out membranes of mock-transfected cells either before or after PIP2 (inward [−100 mV] and outward [+100 mV] currents: −87 ± 32 pA and 117 ± 28 pA, respectively, before PIP2 vs. −135 ± 41 pA and 156 ± 48 pA, respectively, after PIP2; mean ± SEM, n = 6). (C) Ramp I-V curves of currents at indicated time points in B. Scale bars for X (40 ms) and Y axis (0.2 nA) are shown. Dotted line indicates 0 current. In the X axis, the time points corresponding to ramp potentials −100, 0, and +100 mV (from left to right) are indicated by three downward arrows, respectively. Inset shows I-V curves scaled up to the same peak current level.
Figure 2.
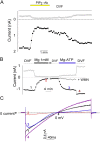
PIP2 is critical for TRPV5 channel activity. (A) Anti-PIP2 antibody reduces TRPV5 currents in inside-out patches. Experiments were repeated five times with similar results. The average (mean ± SEM) inhibition by anti-PIP2 antibody was 88 ± 13% and 79 ± 14% for outward and inward currents, respectively. (B) A representative experiment showing long exposure of inside-out patches to Mg2+ causes run-down of TRPV5, which can be subsequently reactivated by Mg-ATP. // indicates 10 min break. The inhibition by Mg2+ shown here appears to be slower compared with that in Fig. 1 B. This variability is likely due to differences in the configuration and accessibility of excised membranes to perfused bath solutions. Closed and open circles are currents at −100 and +100 mV, respectively. Similar results were observed in six separate experiments. In some experiments, Mg-ATP was applied together with WMN (10 μM). Gray triangles illustrate one such recording receiving Mg-ATP + WMN superimposed on one receiving the Mg-ATP alone. Similar results were observed in four separate experiments. Dimethyl sulfoxide (DMSO, vehicle for WMN, 0.5%) did not prevent reactivation by Mg-ATP (n = 4, not depicted). Of note is that wortmannin did not prevent recovery of currents from transient inhibition by Mg2+ (not depicted), indicating that the slow reversible inhibition is not due to regeneration of PIP2 from lipid kinases. (C) I-V curves of currents at indicated time points in B. In this experiment, voltage ramp from −100 to +100 mV was applied without a 40-ms step at −100 mV as indicated in Fig. 1 A. Dotted line indicates 0 current. In the X axis, the time point corresponding to ramp potential 0 mV is indicated by upward arrow. The characteristic voltage-dependent block in trace 3 is due to free (ionized) Mg2+ (0.13 mM) present in the Mg-ATP solution.
Figure 3.
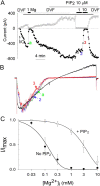
PIP2 decreases the sensitivity to Mg2+-induced slow inhibition but not the voltage-dependent block. (A) Application of PIP2 in inside-out patches increases TRPV5 currents and reduces the sensitivity to inhibition by Mg2+. Voltage ramp protocol is same as in Fig. 1. Holding potential between ramps is 0 mV. (B) Scaled-up I-V curves of currents at indicated time points in A. (C) Dose–response curves of inhibition by Mg2+ in inside-out patches before (no PIP2) and after application of PIP2 (+PIP2). IC50 was obtained by fitting relative inward currents (inward currents at −100 mV normalized to maximal currents; I/Imax) at different Mg2+ concentrations according to the equation I/Imax = IC50/IC50 + [Mg2+].
Figure 4.
Regulation of TRPV5 by intracellular Mg2+ in whole-cell recording. (A) Alteration of intracellular Mg2+ in whole-cell recording using intrapipette perfusion. (B) Intracellular perfusion of Mg2+ (1 mM) in whole-cell recording inhibits TRPV5 reversibly. The Y axis is current density (nA/pF). Time bar for the X axis represents 4 min. (C) I-V curves of currents at indicated time points in B. (D) Time control of intracellular Mg2+ perfusion in mock-transfected CHO cells (transfected with GFP plasmid alone). The Y axis is current density (pA/pF). Time bar for the X axis represents 4 min. (E) Dose-dependent inhibition of whole-cell TRPV5 currents by Mg2+ (0–3 mM). Each experiment at a given Mg2+ concentration was performed as in Fig. 4 B and inward currents were scaled to the same maximal (current at DVF solution; I/Imax = 1) and minimal level (current after La3+; I/Imax = 0). (F) Dose–response curve of Mg2+ inhibition in whole-cell recording (closed squares) vs. in inside-out patches before (closed circles; no PIP2) and after PIP2 (open circles; +PIP2). IC50 was calculated according to the equation I/Imax = IC50 /IC50 + [Mg2+]. I/Imax = relative currents normalized to maximal currents. The two curves for inside-out patches before and after PIP2 are from Fig. 3 C.
Figure 5.
Voltage dependency of the Mg2+-induced slow reversible inhibition. (A) Whole-cell currents were recorded in DVF and 0.3 mM intracellular Mg2+ at different holding potentials (from +50 to −100 mV) as in Fig. 4 B. Relative currents (I/Imax, current at 0.3 mM Mg2+/current at DVF) were plotted against holding potentials (Vh). (B) Dose–response curve of inhibition by Mg2+ at 0 and −50 mV holding potentials. Dose–response curves were performed as in Fig. 4 B.
Figure 6.
Kinetics of Mg2+-induced voltage-dependent block (A and B) and slow inhibition (C and D). (A) Whole-cell recording was performed at fixed intracellular Mg2+ (1 mM). Holding potential was −100 mV. Test pulse to +100 mV is illustrated. Time course of outward current (at +100 mV) from peak current (∼1 ms after test potential) to the current level at 50 ms is shown. Dotted line represents double exponential fit to the current. (B) Fast (squares) and slow (circles) exponential time constant of decrease of outward current from peak current (∼1 ms) to 50 ms of test potentials (+25, +50, +100 mV, respectively). (C) Time course of decrease of outward current from 100 ms to 60 s after test potential to +100 mV. Dotted line represents single exponential fit to the current. (D) Exponential time constants of decrease of outward current between 100 ms and 60 s of test potentials (+25, +50, and +100 mV, respectively).
Figure 7.
Identification of amino acid of TRPV5 involved in Mg2+-induced slow inhibition. (A) Membrane topology of amino acids between the fourth transmembrane (TM4) segment and the proximal COOH terminus (Ct) of TRPV5. Amino acids in the preselectivity filter region likely form a pore helix structure similar to that of KcsA (Dodier et al., 2004; Voets et al., 2004b). The location of amino acids mutated is shown. (B) A representative experiment of D542N mutant (in whole-cell recording) showing no inhibition by 1 mM Mg2+. (C) Dose–response curves of inhibition by Mg2+ for D542N mutant and wild-type (WT) TRPV5. (D) Average inhibition by Mg2+ for WT and each mutant (mean ± SEM, n = 5–11 each). * indicates P < 0.05 vs. WT.
Figure 8.
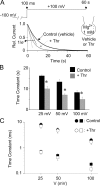
Effects of PIP2 hydrolysis on Mg2+-induced slow inhibition (A and B) and voltage-dependent block (C). (A) Whole-cell currents (between 100 ms and 60 s; at 1 mM intracellular Mg2+) in response to voltage jump from −100 mV holding potential to depolarized test potentials were measured as in Fig. 6 C. Cells were incubated with vehicle (Control) or thrombin + WMN (+Thr) in the extracellular bath for 10 min before patch-clamped for whole-cell recordings. Shown are representative single exponential fits to currents for Control (black curve) or +Thr (gray curve). Relative current level corresponding to 1/e (e, the base of natural logarithms) of the maximal current is shown. (B) Time constants of Mg2+-induced slow inhibition at +25, +50, +100 mV for Control and +Thr. * indicates P < 0.05 +Thr vs. Control. (C) Time constants of Mg2+-induced voltage-dependent block (as in Fig. 6, A and B) at +25, +50, +100 mV for Control and +Thr.
Figure 9.
Effect of PIP2 hydrolysis on the Mg2+-induced slow inhibition. (A) Effect of thrombin plus/minus wortmannin on TRPV5 in cell-attached recording. The top left panel shows cell-attached configuration for recording TRPV5-mediated Ca2+ currents. See text for the pipette solution. Voltage stimuli (step to −100 mV for 40 ms and ramp from −100 to +100 mV ramp over 200 ms) were applied every 2 s from +50 mV holding potential. Holding at +50 mV prevents Ca2+ entry and the Ca2+-dependent inactivation. Thrombin (Thr, 1 U/ml) was applied to the patch membrane by intrapipette perfusion. WMN (10 μM) or vehicle (0.5% DMSO) was applied to the extracellular bath in cells expressing TRPV5 5–10 min before addition of thrombin. The bottom panel shows inward currents (at −100 mV) normalized to the initial current (I/Imax). The top right panel shows ramp I-V curves at indicated time points. (B) Dose–response curve of inhibition by Mg2+ before and after membrane PIP2 hydrolysis. Whole-cell TRPV5-mediated Ca2+ currents were recorded in a bath solution containing (in mM) 140 NaCl, 1 MgCl2, 1 CaCl2, and 10 HEPES (pH 7.4). Intracellular Mg2+ (0 to 3 mM) was altered by intrapipette perfusion. Cells expressing TRPV5 were incubated with a bath solution containing either vehicle (closed circles) or WMN + Thr (open circles) for 5–10 min before patching for whole-cell recording. Voltage protocol and holding potential are as in the cell-attached experiment.
Figure 10.
A working model showing the relationships of three different effects of Mg2+ on TRPV5. Binding of intracellular Mg2+ to D542 of TRPV5 causes a fast (in ms time scale) voltage-dependent block. Prolonged binding to the same site by Mg2+ (e.g., 10 s) leads to slow inhibition, which is likely due to conformational changes of the channel. The slow inhibition is also voltage dependent. Membrane PIP2 stabilizes TRPV5 in open conformation. PIP2 interaction with TRPV5 does not affect Mg2+ binding but prevents Mg2+-induced conformational changes. Mg2+ causes run-down by activating lipid phosphatases. However, run-down is probably not a physiological effect of Mg2+ as it occurs predominantly in excised inside-out membranes. Hydrolysis of PIP2 by activating PLC-coupled receptors sensitizes TRPV5 to inhibition by intracellular Mg2+. * indicates that time constant for Mg2+-induced slow inhibition of TRPV5 is shorter in PIP2-reduced (e.g., 5 s) than in PIP2-repleted state (e.g., 10 s). For comparison, Mg-induced slow inhibition has also been reported for TRPV6, TRPM6, and TRPM7 (Nadler et al., 2001; Runnels et al., 2001; Voets et al., 2003, 2004a). Mg2+-induced voltage-dependent block contributes to inward rectification of many channels, including inward-rectifier K+ channels and TRPV5 and 6. Mg2+ would presumably cause run-down on all PIP2-regulated ion channels.
Similar articles
- The Ca2+-activated cation channel TRPM4 is regulated by phosphatidylinositol 4,5-biphosphate.
Nilius B, Mahieu F, Prenen J, Janssens A, Owsianik G, Vennekens R, Voets T. Nilius B, et al. EMBO J. 2006 Feb 8;25(3):467-78. doi: 10.1038/sj.emboj.7600963. Epub 2006 Jan 19. EMBO J. 2006. PMID: 16424899 Free PMC article. - Phosphatidylinositol 4,5-bisphosphate (PIP(2)) controls magnesium gatekeeper TRPM6 activity.
Xie J, Sun B, Du J, Yang W, Chen HC, Overton JD, Runnels LW, Yue L. Xie J, et al. Sci Rep. 2011;1:146. doi: 10.1038/srep00146. Epub 2011 Nov 9. Sci Rep. 2011. PMID: 22180838 Free PMC article. - Intracellular Ca2+ and the phospholipid PIP2 regulate the taste transduction ion channel TRPM5.
Liu D, Liman ER. Liu D, et al. Proc Natl Acad Sci U S A. 2003 Dec 9;100(25):15160-5. doi: 10.1073/pnas.2334159100. Epub 2003 Dec 1. Proc Natl Acad Sci U S A. 2003. PMID: 14657398 Free PMC article. - Regulation of TRP ion channels by phosphatidylinositol-4,5-bisphosphate.
Qin F. Qin F. Handb Exp Pharmacol. 2007;(179):509-25. doi: 10.1007/978-3-540-34891-7_30. Handb Exp Pharmacol. 2007. PMID: 17217076 Review. - Receptor-mediated signalling pathways acting through hydrolysis of membrane phospholipids in cardiomyocytes.
Lamers JM, De Jonge HW, Panagia V, Van Heugten HA. Lamers JM, et al. Cardioscience. 1993 Sep;4(3):121-31. Cardioscience. 1993. PMID: 8400019 Review.
Cited by
- Dissecting the Mechanism of Action of Spiperone-A Candidate for Drug Repurposing for Colorectal Cancer.
Antona A, Varalda M, Roy K, Favero F, Mazzucco E, Zuccalà M, Leo G, Soggia G, Bettio V, Tosi M, Gaggianesi M, Riva B, Reano S, Genazzani A, Manfredi M, Stassi G, Corà D, D'Alfonso S, Capello D. Antona A, et al. Cancers (Basel). 2022 Feb 2;14(3):776. doi: 10.3390/cancers14030776. Cancers (Basel). 2022. PMID: 35159043 Free PMC article. - Determinants of molecular specificity in phosphoinositide regulation. Phosphatidylinositol (4,5)-bisphosphate (PI(4,5)P2) is the endogenous lipid regulating TRPV1.
Klein RM, Ufret-Vincenty CA, Hua L, Gordon SE. Klein RM, et al. J Biol Chem. 2008 Sep 19;283(38):26208-16. doi: 10.1074/jbc.M801912200. Epub 2008 Jun 23. J Biol Chem. 2008. PMID: 18574245 Free PMC article. - Pharmacological Modulation and (Patho)Physiological Roles of TRPM4 Channel-Part 1: Modulation of TRPM4.
Kovács ZM, Dienes C, Hézső T, Almássy J, Magyar J, Bányász T, Nánási PP, Horváth B, Szentandrássy N. Kovács ZM, et al. Pharmaceuticals (Basel). 2022 Jan 10;15(1):81. doi: 10.3390/ph15010081. Pharmaceuticals (Basel). 2022. PMID: 35056138 Free PMC article. Review. - What structures did, and did not, reveal about the function of the epithelial Ca2+ channels TRPV5 and TRPV6.
Rohacs T, Fluck EC, De Jesús-Pérez JJ, Moiseenkova-Bell VY. Rohacs T, et al. Cell Calcium. 2022 Sep;106:102620. doi: 10.1016/j.ceca.2022.102620. Epub 2022 Jul 3. Cell Calcium. 2022. PMID: 35834842 Free PMC article. Review. - Molecular insights into the structural and dynamical changes of calcium channel TRPV6 induced by its interaction with phosphatidylinositol 4,5-bisphosphate.
Wang L, Cai R, Chen XZ, Peng JB. Wang L, et al. J Biomol Struct Dyn. 2023 Aug-Sep;41(14):6559-6568. doi: 10.1080/07391102.2022.2109752. Epub 2022 Aug 11. J Biomol Struct Dyn. 2023. PMID: 35950523 Free PMC article.
References
- Anast, C.S., J.M. Mohs, S.L. Kaplan, and T.W. Burns. 1972. Evidence for parathyroid failure in magnesium deficiency. Science. 177:606–608. - PubMed
- Clapham, D.E. 2003. TRP channels as cellular sensors. Nature. 426:517–524. - PubMed
- Chuang, H.H., E.D. Prescott, H. Kong, S. Shields, S.E. Jordt, A.I. Basbaum, M.V. Chao, and D. Julius. 2001. Bradykinin and nerve growth factor release the capsaicin receptor from PtdIns(4,5)P2-mediated inhibition. Nature. 411:957–962. - PubMed
- Dickenson, J.M., and S.J. Hill. 1997. Transfected adenosine A1 receptor-mediated modulation of thrombin-stimulated phospholipase C and phospholipase A2 activity in CHO cells. Eur. J. Pharmacol. 321:77–86. - PubMed
- Dodier, Y., U. Banderali, H. Klein, O. Topalak, O. Dafi, M. Simoes, G. Bernatchez, R. Sauve, and L. Parent. 2004. Outer pore topology of the ECaC-TRPV5 channel by cysteine scan mutagenesis. J. Biol. Chem. 279:6853–6862. - PubMed
Publication types
MeSH terms
Substances
Grants and funding
- R01 DK054368/DK/NIDDK NIH HHS/United States
- DK-20543/DK/NIDDK NIH HHS/United States
- DK-59530/DK/NIDDK NIH HHS/United States
- DK-54368/DK/NIDDK NIH HHS/United States
- P01 DK020543/DK/NIDDK NIH HHS/United States
- R01 DK059530/DK/NIDDK NIH HHS/United States
LinkOut - more resources
Full Text Sources
Miscellaneous


