Experimental comparison and cross-validation of the Affymetrix and Illumina gene expression analysis platforms - PubMed (original) (raw)
Comparative Study
. 2005 Oct 19;33(18):5914-23.
doi: 10.1093/nar/gki890. Print 2005.
Affiliations
- PMID: 16237126
- PMCID: PMC1258170
- DOI: 10.1093/nar/gki890
Comparative Study
Experimental comparison and cross-validation of the Affymetrix and Illumina gene expression analysis platforms
Michael Barnes et al. Nucleic Acids Res. 2005.
Abstract
The growth in popularity of RNA expression microarrays has been accompanied by concerns about the reliability of the data especially when comparing between different platforms. Here, we present an evaluation of the reproducibility of microarray results using two platforms, Affymetrix GeneChips and Illumina BeadArrays. The study design is based on a dilution series of two human tissues (blood and placenta), tested in duplicate on each platform. The results of a comparison between the platforms indicate very high agreement, particularly for genes which are predicted to be differentially expressed between the two tissues. Agreement was strongly correlated with the level of expression of a gene. Concordance was also improved when probes on the two platforms could be identified as being likely to target the same set of transcripts of a given gene. These results shed light on the causes or failures of agreement across microarray platforms. The set of probes we found to be most highly reproducible can be used by others to help increase confidence in analyses of other data sets using these platforms.
Figures
Figure 1
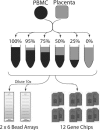
Schematic representation of the experimental design. See Materials and Methods for details. The key features of the design are the use of a single pair of RNA samples for all analyses, mixed together in varying proportions and analyzed in technical replicates on each platform. Unlike the Affymetrix platform, each Illumina BeadArray slide contains multiple arrays, allowing us to analyze a complete dilution series on one slide. Note that the BeadArray slides actually contain eight arrays per slide, but we only used six for the data described here.
Figure 2
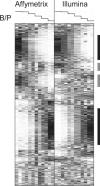
Hierarchical clustering results of all 36 024 comparable pairs of probes. The dilution step is shown as a graph at the top of the figure (Blood/Placenta). Black bars at the side indicate large clusters of genes that appear to show clear dilution effects in both platforms. Gray bars indicate examples of clusters that appear to show dilution effects in one platform but not consistently in the other. Lighter colors indicate higher relative levels of expression on an arbitrary scale. Note that in this figure, if a gene occurs multiple times on one platform, it is shown in all possible valid comparisons with matching probes on the other platform.
Figure 3
Distributions of correlations for the Illumina HumanRef-8 BeadArrays (A) and the Affymetrix HG-U133 Plus 2 arrays (B). Correlations near −1 and 1 reflect probes whose targets are differentially expressed between the two samples. Correlations near zero reflect probes which do not show a dilution effect. The dilution effect is more pronounced for probes targeted at ‘known’ genes. This effect is stronger for Illumina (C) than for Affymetrix (D), though the Illumina platform has fewer probes which cannot be assigned to known genes (Table 1). For complete data see the Supplementary Data.
Figure 4
Distributions of correlations stratified by high and low expression levels (log2) for the Illumina HumanRef-8 BeadArrays (A) and the Affymetrix HG-U133 Plus 2.0 arrays (B). On both platforms, the probes not showing dilution effects tend to express at low levels, whereas highly expressed probes show strong dilution effects. For complete data see the Supplementary Data.
Figure 5
Cross-platform agreement for all ‘known’ genes (A), stratified by differential expression (B) and for placenta/blood specific genes (C). For complete data see the Supplementary Data.
Figure 6
Cross-platform agreement measured by the rank correlation of expression levels as a function of expression level (log2) (A) and distance between probes in base pairs (B). For complete data see the Supplementary Data.
Similar articles
- Evaluation of the similarity of gene expression data estimated with SAGE and Affymetrix GeneChips.
van Ruissen F, Ruijter JM, Schaaf GJ, Asgharnegad L, Zwijnenburg DA, Kool M, Baas F. van Ruissen F, et al. BMC Genomics. 2005 Jun 14;6:91. doi: 10.1186/1471-2164-6-91. BMC Genomics. 2005. PMID: 15955238 Free PMC article. - Redefinition of Affymetrix probe sets by sequence overlap with cDNA microarray probes reduces cross-platform inconsistencies in cancer-associated gene expression measurements.
Carter SL, Eklund AC, Mecham BH, Kohane IS, Szallasi Z. Carter SL, et al. BMC Bioinformatics. 2005 Apr 25;6:107. doi: 10.1186/1471-2105-6-107. BMC Bioinformatics. 2005. PMID: 15850491 Free PMC article. - Three microarray platforms: an analysis of their concordance in profiling gene expression.
Petersen D, Chandramouli GV, Geoghegan J, Hilburn J, Paarlberg J, Kim CH, Munroe D, Gangi L, Han J, Puri R, Staudt L, Weinstein J, Barrett JC, Green J, Kawasaki ES. Petersen D, et al. BMC Genomics. 2005 May 5;6:63. doi: 10.1186/1471-2164-6-63. BMC Genomics. 2005. PMID: 15876355 Free PMC article. - Improving reliability and performance of DNA microarrays.
Sievertzon M, Nilsson P, Lundeberg J. Sievertzon M, et al. Expert Rev Mol Diagn. 2006 May;6(3):481-92. doi: 10.1586/14737159.6.3.481. Expert Rev Mol Diagn. 2006. PMID: 16706748 Review. - Microarray RNA transcriptional profiling: part I. Platforms, experimental design and standardization.
Ahmed FE. Ahmed FE. Expert Rev Mol Diagn. 2006 Jul;6(4):535-50. doi: 10.1586/14737159.6.4.535. Expert Rev Mol Diagn. 2006. PMID: 16824028 Review.
Cited by
- Sharing and reusing gene expression profiling data in neuroscience.
Wan X, Pavlidis P. Wan X, et al. Neuroinformatics. 2007 Fall;5(3):161-75. doi: 10.1007/s12021-007-0012-5. Neuroinformatics. 2007. PMID: 17917127 Free PMC article. Review. - Genetic variation in human gene expression.
Dermitzakis ET, Stranger BE. Dermitzakis ET, et al. Mamm Genome. 2006 Jun;17(6):503-8. doi: 10.1007/s00335-006-0005-y. Epub 2006 Jun 12. Mamm Genome. 2006. PMID: 16783632 Review. - Gene expression meta-analysis supports existence of molecular apocrine breast cancer with a role for androgen receptor and implies interactions with ErbB family.
Sanga S, Broom BM, Cristini V, Edgerton ME. Sanga S, et al. BMC Med Genomics. 2009 Sep 11;2:59. doi: 10.1186/1755-8794-2-59. BMC Med Genomics. 2009. PMID: 19747394 Free PMC article. - Transcriptional survey of alveolar macrophages in a murine model of chronic granulomatous inflammation reveals common themes with human sarcoidosis.
Mohan A, Malur A, McPeek M, Barna BP, Schnapp LM, Thomassen MJ, Gharib SA. Mohan A, et al. Am J Physiol Lung Cell Mol Physiol. 2018 Apr 1;314(4):L617-L625. doi: 10.1152/ajplung.00289.2017. Epub 2017 Dec 6. Am J Physiol Lung Cell Mol Physiol. 2018. PMID: 29212802 Free PMC article. - Illumina WG-6 BeadChip strips should be normalized separately.
Shi W, Banerjee A, Ritchie ME, Gerondakis S, Smyth GK. Shi W, et al. BMC Bioinformatics. 2009 Nov 11;10:372. doi: 10.1186/1471-2105-10-372. BMC Bioinformatics. 2009. PMID: 19903361 Free PMC article.
References
- Lockhart D.J., Dong H., Byrne M.C., Follettie M.T., Gallo M.V., Chee M.S., Mittmann M., Wang C., Kobayashi M., Horton H., et al. Expression monitoring by hybridization to high-density oligonucleotide arrays. Nat. Biotechnol. 1996;14:1675–1680. - PubMed
- Park P.J., Cao Y.A., Lee S.Y., Kim J.W., Chang M.S., Hart R., Choi S. Current issues for DNA microarrays: platform comparison, double linear amplification, and universal RNA reference. J. Biotechnol. 2004;112:225–245. - PubMed
Publication types
MeSH terms
Substances
Grants and funding
- AR048929/AR/NIAMS NIH HHS/United States
- AR47784/AR/NIAMS NIH HHS/United States
- AR50688/AR/NIAMS NIH HHS/United States
- P01 AR048929/AR/NIAMS NIH HHS/United States
- AR47363/AR/NIAMS NIH HHS/United States
- R01 AR050688/AR/NIAMS NIH HHS/United States
- GM076880/GM/NIGMS NIH HHS/United States
- P60 AR047784/AR/NIAMS NIH HHS/United States
- P30 AR047363/AR/NIAMS NIH HHS/United States
LinkOut - more resources
Full Text Sources
Other Literature Sources


