Comparison of alpha2 nicotinic acetylcholine receptor subunit mRNA expression in the central nervous system of rats and mice - PubMed (original) (raw)
Comparative Study
. 2005 Dec 12;493(2):241-60.
doi: 10.1002/cne.20762.
Affiliations
- PMID: 16255031
- PMCID: PMC4289636
- DOI: 10.1002/cne.20762
Comparative Study
Comparison of alpha2 nicotinic acetylcholine receptor subunit mRNA expression in the central nervous system of rats and mice
Katsuyoshi Ishii et al. J Comp Neurol. 2005.
Abstract
The nicotinic acetylcholine receptor (nAChR) alpha2 subunit was the first neuronal nAChR to be cloned. However, data for the distribution of alpha2 mRNA in the rodent exists in only a few studies. Therefore, we investigated the expression of alpha2 mRNA in the rat and mouse central nervous systems using nonradioactive in situ hybridization histochemistry. We detected strong hybridization signals in cell bodies located in the internal plexiform layer of the olfactory bulb, the interpeduncular nucleus of the midbrain, the ventral and dorsal tegmental nuclei, the median raphe nucleus of the pons, the ventral part of the medullary reticular nucleus, the ventral horn in the spinal cord of both rats and mice, and in a few Purkinje cells of rats, but not of mice. Cells that moderately express alpha2 mRNA were localized to the cerebral cortex layers V and VI, the subiculum, the oriens layer of CA1, the medial septum, the diagonal band complex, the substantia innominata, and the amygdala of both animals. They were also located in a few midbrain nuclei of rats, whereas in mice they were either few or absent in these areas. However, in the upper medulla oblongata alpha2 mRNA was expressed in several large neurons of the gigantocellular reticular nucleus and the raphe magnus nucleus of mice, but not of rats. The data obtained show that a similar pattern of alpha2 mRNA expression exists in both rats and mice, with the exception of a few regions, and provide the basis for cellular level analysis.
Figures
Fig. 1
Regions unique to the rat and mouse neuronal nAChR α 2 sequences.
Fig. 2
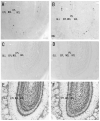
Photomicrographs showing hybridization with nAChR α 2 subunit antisense-riboprobes in the rat (A) and mouse (B), sense-riboprobes in the rat (C) and mouse (D), and Nissl-stained sections of the same regions in the rat (E) and mouse (F) main olfactory bulb of coronal sections. A and B: Most of the α 2 mRNA expressing cells are located in the internal plexiform layer of the olfactory bulb (IPL), which is a thin layer inside the mitral cell layer (MCL). Arrow shows an α 2 mRNA expressing cell around the border of glomerular (GLL) and external plexiform (EPL) layers. C and D: Sense-riboprobe did not detect any signals. Scale bar = 100 μm.
Fig. 3
Photomicrographs showing hybridization with nAChR α 2 subunit probes in the rat (A) and mouse (B) and Nissl-stained sections of the same regions in the rat (C) and mouse (D) cerebral cortex of coronal sections. A and B: Moderate α 2 mRNA expression is localized to the scattered neurons of layers V and VI (arrows). Scale bar = 100 μm.
Fig. 4
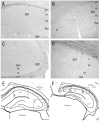
Photomicrographs showing hybridization with nAChR α 2 subunit probes in the rat (A, C) and mouse (B, D) hippocampal formation of coronal sections. A and C: Interneurons of the oriens layer (Or) and the alveus (alv) of CA1 and CA3 have oval or elongated somata, and are mainly oriens-lacunosum molecule (O-LM) cells. B: Weak α 2 mRNA expression is localized to the subiculum and interneurons of the oriens layer and the alveus of CA1 in the mouse. D: After in situ hybrydization histochemistry was carried out, the section was mounted on a slide temporarily with 0.1M Tris-HCl buffered saline and photographed. Compared with Figure 4B, α 2 mRNA expression is much more distinct. E and F: The boxes on the diagrams of rat (E) and mouse (F) hippocampus-coronal sections show the approximate location of the areas photomicrographed (A-D). Black dots show the distribution of α 2 mRNA expressing cells. Scale bars = 100 μm in A (also applies to C), B (also applies to D).
Fig. 5
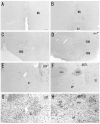
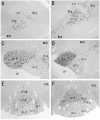
Photomicrographs showing hybridization with nAChR α 2 subunit probes in the rat (A, C, E) and mouse (B, D, F) ventral regions. α 2 mRNA is expressed in the neurons of ventral regions; A and B: medial septal nucleus (MS), C and D: diagonal band complex (VDB and HDB), E and F: substantia innominata (SI) and ventral pallidum (VP). G and H: Nissl-stained sections of the same regions of Figures 5E and F in the rat (G) and mouse (H), respectively. Coronal sections (A, C, E, and G). Horizontal section (B). Sagittal sections (D, F, and H). Scale bar = 100 μm.
Fig. 6
Photomicrographs showing hybridization with nAChR α 2 subunit probes in the rat (A, C) and mouse (B) amygdaloid nuclei of coronal sections. A and B: α 2 mRNA is expressed in the neurons of amygdaloid nuclei (Me, Ce, and BM). C: Between the entorhinal cortex and the medial amygdaloid nucleus, α 2 mRNA is expressed in medium-sized cells of the posteromedial cortical amygdaloid nucleus (PMCo). This cluster consists of individual cells expressing α 2 mRNA, although the outlines of these cells are not clearly defined. Several α 2 mRNA expressing cells are localized to the subiculum (S): medium-sized cells (Fig. 7F). D: The box on the diagram of the rat amygdala- coronal section shows the approximate location of the areas photomicrographed. Black dots show the distribution of α 2 mRNA expressing cells in rats (A). Same regions photomicrographed in mice (B). Scale bars = 100 μm in A (also applies to B), C.
Fig. 7
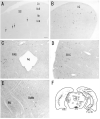
Photomicrographs showing hybridization with nAChR α 2 subunit probes in the rat (A - E) midbrain. A: A few α 2 mRNA expressing cells located in the optic nerve layer of the superior colliculus (SC) have medium-sized cell bodies and are round or multipolar in shape (arrows). B: Many α 2 mRNA expressing cells are scattered around the inferior colliculus (IC). C, D, and E: Several α 2 mRNA expressing cells are located in the periaqueductal gray (PAG), the nucleus brachium inferior colliculus (BIC), and the deep mesencephalic reticular nucleus (DpMe), respectively. F: The boxes on the diagram of the rat midbrain- coronal section show the approximate location of the areas photomicrographed (Figs. 6C, 7C, D, E). Black dots show the distribution of α 2 mRNA expressing cells in rats. Sagittal sections (A and B). Coronal sections (C-E). Scale bar = 100 μm.
Fig. 8
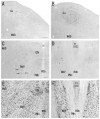
Photomicrographs showing hybridization with nAChR α 2 subunit probes in the rat (A, C, E) and mouse (B, D, F) midbrain and pons. In the midbrain, α 2 mRNA is localized to the interpeduncular nucleus (IP), and in the pons, ventral (VTg) and dorsal (DTg) tegmental nuclei and the median raphe nucleus (MnR). A and B: In the ventral and dorsal tegmentum, α 2 mRNA expressing cells are seen in a large, loosely aggregated cluster extending from the caudal midbrain into the rostral pontine tegmentum. C-F: α 2 mRNA expression is most intensely distributed in the rostral subnucleus of the IP (IP-R). These cells are found in a region extending from the dorsal part of the IP, in a caudodorsal direction through the midbrain reticular formation into the area surrounding the superior cerebellar peduncle. They form an intense band in sagittal sections. Sagittal sections (A-D). Coronal sections (E and F). Scale bars = 100 μm in A (also applies to C, E), B (also applies to D, F).
Fig. 9
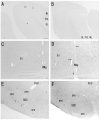
Photomicrographs showing hybridization with nAChR α 2 subunit probes in the rat (A, C, E) and mouse (B, D, F). A and B: In the cerebellum, intense α 2 mRNA expression is localized to a small number of Purkinje cells of rats in the Purkinje cell layer (A), whereas α 2 mRNA expression in mice Purkinje cells is absent (B). C and D: In the upper meddula oblongata, α 2 mRNA is scattered in several large neurons of the gigantocellular reticular nucleus (Gi) and the raphe magnus nucleus (RMg) in mice (D), but not in rats (C). Arrows (D) indicate α 2 mRNA expressing cells in the RMg. E and F: In the ventral region of the caudal pons, α 2 mRNA is localized to several small-sized cells of the superior olivary complex (SOC), especially the periolivary nucleus. Sagittal sections (A, B, E, and F). Coronal sections (C and D). Scale bars = 100 μm in A (also applies to B), C (also applies to D-F).
Fig. 10
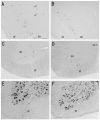
Photomicrographs showing hybridization with nAChR α 2 subunit probes in the rat (A, C) and mouse (B, D) and Nissl-stained sections of the same regions in the rat (E) and mouse (F) medulla oblongata. A and B: Weak α 2 mRNA expression is located in dorsal neurons of the cuneate nucleus (Cu) of both animals. C and D: In the lower medulla oblongata, α 2 mRNA is localized to several cells in the ventral part of the medullary reticular nucleus (MdV). These cells are small to medium-sized and multipolar or fusiform in shape. Arrows (C) indicate α 2 mRNA expressing cells in the ventral part of MdV. Sagittal sections (A, B). Adjacent coronal sections (C, E) and horizontal sections (D, F). Scale bars = 100 μm in A (also applies to B), C (also applies to D - F).
Fig. 11
Photomicrographs showing hybridization with nAChR α 2 subunit probes in the rat (A, C) and mouse (B, D) spinal cord and Nissl-stained sections of the same regions in the rat (E) and mouse (F) spinal cord. A and B: α 2 mRNA expression is localized to several small to medium-sized cells of the ventral horn (VH). Arrows (A) indicate α 2 mRNA expressing cells in the dorsal regions of the ventral horn. Sagittal sections (A, B) and coronal sections (C - F). Scale bar = 100 μm.
Fig. 12
Schematic diagram of the distribution of nAChR α 2 subunit mRNA in the rat and mouse central nervous systems. Black dots show the common distribution of α 2 mRNA expressing cells in rats and mice. Stars show area of exclusive α 2 mRNA expression in rats. Open circles show the exclusive distribution of α 2 mRNA in mice.
Similar articles
- Mu, delta, and kappa opioid receptor mRNA expression in the rat CNS: an in situ hybridization study.
Mansour A, Fox CA, Burke S, Meng F, Thompson RC, Akil H, Watson SJ. Mansour A, et al. J Comp Neurol. 1994 Dec 15;350(3):412-38. doi: 10.1002/cne.903500307. J Comp Neurol. 1994. PMID: 7884049 - Distribution of pre-pro-glucagon and glucagon-like peptide-1 receptor messenger RNAs in the rat central nervous system.
Merchenthaler I, Lane M, Shughrue P. Merchenthaler I, et al. J Comp Neurol. 1999 Jan 11;403(2):261-80. doi: 10.1002/(sici)1096-9861(19990111)403:2<261::aid-cne8>3.0.co;2-5. J Comp Neurol. 1999. PMID: 9886047 - Nicotinic acetylcholine receptor subunit mRNA expression in adult and developing rat medullary catecholamine neurons.
O'Leary KT, Loughlin SE, Chen Y, Leslie FM. O'Leary KT, et al. J Comp Neurol. 2008 Oct 20;510(6):655-72. doi: 10.1002/cne.21833. J Comp Neurol. 2008. PMID: 18698592
Cited by
- Neuronal nicotinic receptors as analgesic targets: it's a winding road.
Umana IC, Daniele CA, McGehee DS. Umana IC, et al. Biochem Pharmacol. 2013 Oct 15;86(8):1208-14. doi: 10.1016/j.bcp.2013.08.001. Epub 2013 Aug 12. Biochem Pharmacol. 2013. PMID: 23948066 Free PMC article. Review. - Postnatal expression of alpha2 nicotinic acetylcholine receptor subunit mRNA in developing cortex and hippocampus.
Son JH, Winzer-Serhan UH. Son JH, et al. J Chem Neuroanat. 2006 Dec;32(2-4):179-90. doi: 10.1016/j.jchemneu.2006.09.001. Epub 2006 Oct 12. J Chem Neuroanat. 2006. PMID: 17046198 Free PMC article. - Pharmacological and immunochemical characterization of alpha2* nicotinic acetylcholine receptors (nAChRs) in mouse brain.
Whiteaker P, Wilking JA, Brown RW, Brennan RJ, Collins AC, Lindstrom JM, Boulter J. Whiteaker P, et al. Acta Pharmacol Sin. 2009 Jun;30(6):795-804. doi: 10.1038/aps.2009.68. Acta Pharmacol Sin. 2009. PMID: 19498420 Free PMC article. - Attenuation of nicotine taking and seeking in rats by the stoichiometry-selective alpha4beta2 nicotinic acetylcholine receptor positive allosteric modulator NS9283.
Maurer JJ, Sandager-Nielsen K, Schmidt HD. Maurer JJ, et al. Psychopharmacology (Berl). 2017 Feb;234(3):475-484. doi: 10.1007/s00213-016-4475-7. Epub 2016 Nov 14. Psychopharmacology (Berl). 2017. PMID: 27844094 - Cellular events in nicotine addiction.
Penton RE, Lester RA. Penton RE, et al. Semin Cell Dev Biol. 2009 Jun;20(4):418-31. doi: 10.1016/j.semcdb.2009.01.001. Epub 2009 Jan 20. Semin Cell Dev Biol. 2009. PMID: 19560047 Free PMC article. Review.
References
- Alheid GF, de Olmos JS, Beltramino CA. Amygdala and extended amygdala. In: Paxinos G, editor. The rat nervous system. 2nd Academic press; San Diego: 1995. pp. 495–578.
- Amaral DG, Witter MP. Hippocampal formation. In: Paxinos G, editor. The rat nervous system. 2nd Academic press; San Diego: 1995. pp. 443–493.
- Armstrong DM, Saper CB, Levey AI, Wainer H, Terry RD. Distribution of cholinergic neurons in rat brain: demonstrated by the immunocytochemical localization of choline acetyltransferase. J Comp Neurol. 1983;284:314–335. - PubMed
- Azam L, Winzer-Serhan UH, Chen Y, Leslie FM. Expression of nicotinic acetylcholine receptor subunit mRNAs within midbrain dopamine neurons. J Comp Neurol. 2002;444:260–274. - PubMed
Publication types
MeSH terms
Substances
LinkOut - more resources
Full Text Sources
Molecular Biology Databases
Miscellaneous

