Kinetic analysis of Smad nucleocytoplasmic shuttling reveals a mechanism for transforming growth factor beta-dependent nuclear accumulation of Smads - PubMed (original) (raw)
Kinetic analysis of Smad nucleocytoplasmic shuttling reveals a mechanism for transforming growth factor beta-dependent nuclear accumulation of Smads
Bernhard Schmierer et al. Mol Cell Biol. 2005 Nov.
Abstract
Upon transforming growth factor beta (TGF-beta) stimulation, Smads accumulate in the nucleus, where they regulate gene expression. Using fluorescence perturbation experiments on Smad2 and Smad4 fused to either enhanced green fluorescent protein or photoactivatable green fluorescent protein, we have studied the kinetics of Smad nucleocytoplasmic shuttling in a quantitative manner in vivo. We have obtained rate constants for import and export of Smad2 and show that the cytoplasmic localization of Smad2 in uninduced cells reflects its nuclear export being more rapid than import. We find that TGF-beta-induced nuclear accumulation of Smad2 is caused by a pronounced drop in the export rate of Smad2 from the nucleus, which is associated with a strong decrease in nuclear mobility of Smad2 and Smad4. TGF-beta-induced nuclear accumulation involves neither a release from cytoplasmic retention nor an increase in Smad2 import rate. Hence, TGF-beta-dependent nuclear accumulation of Smad2 is caused exclusively by selective nuclear trapping of phosphorylated, complexed Smad2. The proposed mechanism reconciles signal-dependent nuclear accumulation of Smad2 with its continuous nucleocytoplasmic cycling properties.
Figures
FIG. 1.
Characterization of the cell lines used. Whole-cell extracts were subjected to immunoblotting with antibodies as indicated. A. Parental cells (HaCaT) and cell lines expressing PAGFP (PAGFP), PAGFP-tagged Smad2 (PAS2) and EGFP-tagged Smad2 (ES2). PAGFP alone is highly expressed, PAGFP-Smad2 and EGFP-Smad2 are both expressed at levels comparable to endogenous Smad2 and are readily phosphorylated in response to 1 h treatment with 2 ng/ml TGF-β (Tβ). B. EGFP-Smad2 phosphorylation exhibits a very similar kinetics as endogenous Smad2 phosphorylation in response to TGF-β. Upon addition of SB-431542 to cells that have been pretreated with TGF-β, EGFP-Smad2 and endogenous Smad2 become dephosphorylated with highly similar kinetics. C. Cell lines expressing PAGFP-Smad4 (PAS4) and EGFP-Smad4 (ES4). Both proteins are expressed at approximately endogenous levels.
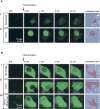
FIG. 2.
Compartment-specific photoactivation of PAGFP-Smad2. Cells are shown directly before photoactivation (B/A), and 0, 1, 5, and 12 min after a 10- to 20-second photoactivation of a specific compartment. The shaded area in the phase contrast pictures indicates the actual photoactivation area. A. Nuclear photoactivation of PAGFP-Smad2 by repeatedly scanning an area containing the nucleus in cells treated for 15 min with SB-431542 (i) or cells induced for 1 h with TGF-β (ii). In SB-431542-treated cells, PAGFP-Smad2 photoactivated in the nucleus accumulates in the cytoplasm, reaching a distribution typical for an uninduced cell. Despite strong nuclear accumulation in TGF-β-treated cells, a significant proportion of PAGFP-Smad2 becomes visible in the cytoplasm with increasing time. B. Cytoplasmic photoactivation by scanning an area comprising the whole cytoplasm but excluding the nucleus. (i) SB-431542-treated cells quickly reach a steady-state distribution typical for uninduced cells. In TGF-β-treated cells, which have reached a state of maximal accumulation prior to photoactivation, cytoplasmically photoactivated PAGFP-Smad2 still accumulates in the nucleus, provided the receptors are active (ii), but not if receptors have been inactivated by SB-431542 added 90 min after the TGF-β and 10 min before photoactivation (iii). Pictures show representatives from at least 3 independent experiments.
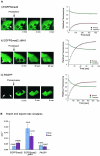
FIG.3.
Import and export rate constants. A. Nuclei of SB-431542-treated cells expressing EGFP-Smad2 (i) or EGFP-Smad2 ΔMH1 (ii) were photobleached. The reappearance of nuclear fluorescence in the nucleus and the fluorescence loss in the cytoplasm were monitored until a steady state was reached. Alternatively, the cytoplasm of untreated, PAGFP-expressing cells was photoactivated (iii) and the redistribution of fluorescence was monitored as above. In the graphs, circles represent experimental points and solid lines are theoretical curves derived from the experimental data, assuming first-order kinetics. From the curves, import rate constants and export rate constants were calculated (see Fig. S1 in the supplemental material). Pictures show representative experiments with fluorescence perturbation performed in either 1 cell (i) or two cells (ii and iii). B. Import and export rate constants obtained for EGFP-Smad2, EGFP-Smad2 ΔMH1 and PAGFP. Bars show means ± standard deviations (n = 10).
FIG. 4.
Nucleocytoplasmic distribution of EGFP-Smads in induced and uninduced cells. A. EGFP-Smad2 cells and EGFP-Smad4 cells were induced with TGF-β for 1 h or were treated with SB-431542. Pictures show representative images for each condition. B. Mean fluorescence intensities of the nucleus (Fn) and the cytoplasm (Fc) were measured and the fluorescence ratio R was calculated. Bars show means ± standard deviations, n was 30 for each condition. C. Using R and an average ratio A between accessible cytoplasmic and accessible nuclear volume of 2.9 as obtained from kinetic experiments (Fig. 3 and Fig. S1 in the supplemental material), relative amounts of EGFP-Smad in the cytoplasm and nucleus of uninduced cells were calculated. Moreover, we estimated the relative fraction of EGFP-Smad that is nuclear in response to TGF-β. For details see the text. Values are given as a percentage of total cellular EGFP-Smad.
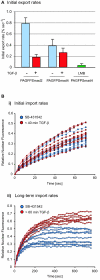
FIG. 5.
TGF-β stimulation affects the export rate of the Smads, but not the import rate. A. Cell lines expressing PAGFP-Smad2 and PAGFP-Smad4 were treated for 1 h as indicated and entire nuclei were photoactivated for 5 to 10 seconds. Loss of nuclear fluorescence due to export was monitored for 60 seconds after photoactivation. Data were normalized to the initial nuclear fluorescence directly after photoactivation and an initial export rate was obtained. Bars represent mean values and standard deviations obtained from 20 cells for each condition. Note that the export rate for Smad2 in unstimulated cells agrees well with the export rate constant obtained in Fig. 3. B. Nuclear import. Entire nuclei of EGFP-Smad2 cells were photobleached. Nuclear fluorescence immediately after the bleach was set to zero and reappearance of nuclear fluorescence was measured. Values were normalized for expression levels, each curve represents a single cell. (i) Initial nuclear import in SB-431542-treated cells (blue curves) and cells treated with TGF-β for between 10 and 40 min, i.e., during the actual accumulation phase before establishment of a steady state (red curves). (ii) Nuclear import in cells treated for 1 h with SB-431542 (blue curves) and cells treated for 1 h with TGF-β and hence having reached a steady state of nuclear accumulation (red curves).
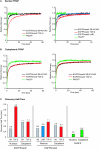
FIG.6.
Assessment of Smad mobilities in the nucleus and cytoplasm by FRAP. FRAP was performed on EGFP-Smad2- and EGFP-Smad4-expressing cells treated for 1 h with SB-431542 (SB), TGF-β or LMB. The curves represent data from 10 cells in each case. A. Nuclear recovery curves for EGFP-Smad2 (left panel) and EGFP-Smad4 (right panel). For comparison, the much faster recovery of photoactivated PAGFP, which is thought to be exclusively due to diffusion is shown. B. Cytoplasmic recovery curves of EGFP-Smad2 (left panel) and EGFP-Smad4 (right panel) in cells treated as indicated. Recovery of photoactivated PAGFP is shown for comparison. C. Recovery half-times, i.e., time after which the corresponding recovery curve has reached 0.5.
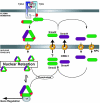
FIG. 7.
Schematic model of Smad nucleocytoplasmic transport. For details, refer to the text. Red oval, phosphate group. NPC, nuclear pore complex. TF, transcription factor. TβR-I, TGF-β receptor type I. TβR-II, TGF-β receptor type II.
Similar articles
- Analysis of Smad nucleocytoplasmic shuttling in living cells.
Nicolás FJ, De Bosscher K, Schmierer B, Hill CS. Nicolás FJ, et al. J Cell Sci. 2004 Aug 15;117(Pt 18):4113-25. doi: 10.1242/jcs.01289. Epub 2004 Jul 27. J Cell Sci. 2004. PMID: 15280432 - Nucleocytoplasmic shuttling of Smad proteins.
Hill CS. Hill CS. Cell Res. 2009 Jan;19(1):36-46. doi: 10.1038/cr.2008.325. Cell Res. 2009. PMID: 19114992 Review. - Green fluorescent protein-tagging reduces the nucleocytoplasmic shuttling specifically of unphosphorylated STAT1.
Meyer T, Begitt A, Vinkemeier U. Meyer T, et al. FEBS J. 2007 Feb;274(3):815-26. doi: 10.1111/j.1742-4658.2006.05626.x. FEBS J. 2007. PMID: 17288561 - Kinesin-mediated transport of Smad2 is required for signaling in response to TGF-beta ligands.
Batut J, Howell M, Hill CS. Batut J, et al. Dev Cell. 2007 Feb;12(2):261-74. doi: 10.1016/j.devcel.2007.01.010. Dev Cell. 2007. PMID: 17276343 - Regulation of Smad activities.
Xu L. Xu L. Biochim Biophys Acta. 2006 Nov-Dec;1759(11-12):503-13. doi: 10.1016/j.bbaexp.2006.11.001. Epub 2006 Nov 15. Biochim Biophys Acta. 2006. PMID: 17182123 Free PMC article. Review.
Cited by
- Burst BMP triggered receptor kinase activity drives Smad1 mediated long-term target gene oscillation in C2C12 cells.
Schul D, Schmitt A, Regneri J, Schartl M, Wagner TU. Schul D, et al. PLoS One. 2013;8(4):e59442. doi: 10.1371/journal.pone.0059442. Epub 2013 Apr 1. PLoS One. 2013. PMID: 23560048 Free PMC article. - Glycosaminoglycan modifications of betaglycan regulate ectodomain shedding to fine-tune TGF-β signaling responses in ovarian cancer.
Choi AS, Jenkins-Lane LM, Barton W, Kumari A, Lancaster C, Raulerson C, Ji H, Altomare D, Starr MD, Whitaker R, Phaeton R, Arend R, Shtutman M, Nixon AB, Hempel N, Lee NY, Mythreye K. Choi AS, et al. Cell Commun Signal. 2024 Feb 15;22(1):128. doi: 10.1186/s12964-024-01496-y. Cell Commun Signal. 2024. PMID: 38360757 Free PMC article. - State- and stimulus-specific dynamics of SMAD signaling determine fate decisions in individual cells.
Bohn S, Hexemer L, Huang Z, Strohmaier L, Lenhardt S, Legewie S, Loewer A. Bohn S, et al. Proc Natl Acad Sci U S A. 2023 Mar 7;120(10):e2210891120. doi: 10.1073/pnas.2210891120. Epub 2023 Mar 1. Proc Natl Acad Sci U S A. 2023. PMID: 36857347 Free PMC article. - Informatics approaches to understanding TGFbeta pathway regulation.
Kahlem P, Newfeld SJ. Kahlem P, et al. Development. 2009 Nov;136(22):3729-40. doi: 10.1242/dev.030320. Development. 2009. PMID: 19855015 Free PMC article. Review. - Smad4 controls proliferation of interstitial cells in the neonatal kidney.
McCarthy SS, Karolak M, Oxburgh L. McCarthy SS, et al. Development. 2022 Jan 1;149(1):dev199984. doi: 10.1242/dev.199984. Epub 2022 Jan 4. Development. 2022. PMID: 34878095 Free PMC article.
References
- Chen, H. B., J. G. Rud, K. Lin, and L. Xu. 2005. Nuclear targeting of TGF-β-activated Smad complexes. J. Biol. Chem. 280:21329-21336. - PubMed
- Hager, G. L., C. Elbi, and M. Becker. 2002. Protein dynamics in the nuclear compartment. Curr. Opin. Genet. Dev. 12:137-141. - PubMed
Publication types
MeSH terms
Substances
LinkOut - more resources
Full Text Sources
Other Literature Sources
Molecular Biology Databases
Miscellaneous

