Genomic variability within an organism exposes its cell lineage tree - PubMed (original) (raw)
Genomic variability within an organism exposes its cell lineage tree
Dan Frumkin et al. PLoS Comput Biol. 2005 Oct.
Abstract
What is the lineage relation among the cells of an organism? The answer is sought by developmental biology, immunology, stem cell research, brain research, and cancer research, yet complete cell lineage trees have been reconstructed only for simple organisms such as Caenorhabditis elegans. We discovered that somatic mutations accumulated during normal development of a higher organism implicitly encode its entire cell lineage tree with very high precision. Our mathematical analysis of known mutation rates in microsatellites (MSs) shows that the entire cell lineage tree of a human embryo, or a mouse, in which no cell is a descendent of more than 40 divisions, can be reconstructed from information on somatic MS mutations alone with no errors, with probability greater than 99.95%. Analyzing all approximately 1.5 million MSs of each cell of an organism may not be practical at present, but we also show that in a genetically unstable organism, analyzing only a few hundred MSs may suffice to reconstruct portions of its cell lineage tree. We demonstrate the utility of the approach by reconstructing cell lineage trees from DNA samples of a human cell line displaying MS instability. Our discovery and its associated procedure, which we have automated, may point the way to a future "Human Cell Lineage Project" that would aim to resolve fundamental open questions in biology and medicine by reconstructing ever larger portions of the human cell lineage tree.
Conflict of interest statement
Competing interests. A patent application may be made on the results reported.
Figures
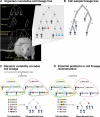
Figure 1. Cell Lineage Concepts
(A) Multicellular organism development can be represented by a rooted labeled binary tree called the organism cumulative cell lineage tree. Nodes (circles) represent cells (dead cells are crossed), and each edge (line) connects a parent with a daughter. The uncrossed leaves, marked blue, represent extant cells. (B) Any cell sample (A–E) induces a subtree, which can be condensed by removing nonbranching internal nodes and labeling the edges with the number of cell divisions between the remaining nodes. The resulting tree is called the cell sample lineage tree. (C) A small fraction of a genome accumulating substitution mutations (colored) is shown. Lineage analysis utilizes a representation of this small fraction, called the cell identifier. Phylogenetic analysis reconstructs the tree from the cell identifiers of the samples. If the topology of the cell sample lineage tree is known, reconstruction can be scored. (D) Coincident mutations, namely two or more identical mutations that occur independently in different cell divisions (blue mutation in A and B), and silent cell divisions, namely cell divisions in which no mutation occurs (D–F), may result in incorrect (red edge) or incomplete (unresolved ternary red node) lineage trees. Excessive mutation rates might result in successive mutations (not shown), which cause the lineage information to be lost.
Figure 2. Simulation of MS Mutations and Reconstruction Score on Random Trees
Two types of random trees with 32 leaves were generated, and MS stepwise mutations were simulated. Results of simulations of wild-type human using different numbers of MS loci are shown. The white line marks the perfect score limit (according to the Penny and Hendy tree comparison algorithm [29]). The results show that it is possible to accurately reconstruct the correct tree for trees of depth equivalent to human newborn and mouse newborn (marked by blue and green dots, respectively) using the entire set of MS loci. A mathematical analysis proves that any tree of depth 40 (equivalent to mouse newborn) can be reconstructed with no errors. Simulations with MS mutation rates of MMR-deficient organisms demonstrate that cell lineage reconstruction is possible with as few as 800 MS loci (the white line indicates the 0.95 score). The quality of reconstruction depends on the topology of the tree and its maximal depth, which together influence the signal-to-noise ratio.
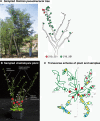
Figure 3. Analysis of Whole Organisms
(A) Photograph and scheme of the R. pseudoacacia tree used for the lineage experiment. All three identically mutated samples (red) come from the same small branch. (B) A. thaliana plant used for the experiment. The location of each sample is indicated. (C) Transverse scheme of the A. thaliana plant showing all sampled stem (rectangles) and cauline leaf (ovals) tissues. Mutations that occurred in two or more samples are depicted by colored circles.
Figure 4. Automated Procedure for Lineage Tree Reconstruction
The procedure accepts biological samples and PCR primers as input, and outputs a reconstructed lineage tree. It consists of a series of seven consecutive steps (numbered), during which the physical biological samples are “transformed” into digital data, which are then analyzed algorithmically. We built a hybrid in vitro/in silico automated system that performs steps 2–7 of the procedure (outlined), and used it to process DNA from tissue samples and single-cell clones. Incorporation of whole genome amplification techniques in the future may enable processing of single cells as well. For a detailed specification of the procedure, see Protocol S1.
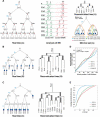
Figure 5. CCT Model System
(A–C) A cell sample lineage tree with a predesigned topology is created by performing single-cell bottlenecks on all the nodes of the tree. Lineage analysis is performed on clones of the root and leaf cells. Three CCTs (A–C) were created using LS174T cells that display MS instability. All topologies were reconstructed precisely. Edge lengths are drawn in proportion to the output of the algorithm. Gray edges represent correct partitions according to the Penny and Hendy tree comparison algorithm [29], and their width represents the bootstrap value [29] (n = 1,000) of the edge. A minimal set of loci yielding perfect reconstruction was found for each CCT (each colored contour represents a different mutation shared by the encircled nodes; see also Figure S2). (D) There is a linear correlation (R 2 = 0.955) between reconstructed and actual node depths. (E) Reconstruction scores of CCTs A–C using random subsets of MS loci of increasing sizes (average of 500).
Similar articles
- [Development of antituberculous drugs: current status and future prospects].
Tomioka H, Namba K. Tomioka H, et al. Kekkaku. 2006 Dec;81(12):753-74. Kekkaku. 2006. PMID: 17240921 Review. Japanese. - Comparing algorithms that reconstruct cell lineage trees utilizing information on microsatellite mutations.
Chapal-Ilani N, Maruvka YE, Spiro A, Reizel Y, Adar R, Shlush LI, Shapiro E. Chapal-Ilani N, et al. PLoS Comput Biol. 2013;9(11):e1003297. doi: 10.1371/journal.pcbi.1003297. Epub 2013 Nov 14. PLoS Comput Biol. 2013. PMID: 24244121 Free PMC article. - A phylogenetic approach to mapping cell fate.
Salipante SJ, Horwitz MS. Salipante SJ, et al. Curr Top Dev Biol. 2007;79:157-84. doi: 10.1016/S0070-2153(06)79006-8. Curr Top Dev Biol. 2007. PMID: 17498550 Review. - Stem cells as common ancestors in a colorectal cancer ancestral tree.
Shibata D. Shibata D. Curr Opin Gastroenterol. 2008 Jan;24(1):59-63. doi: 10.1097/MOG.0b013e3282f2a2e9. Curr Opin Gastroenterol. 2008. PMID: 18043234 Review. - Functional genomic, computational and proteomic analysis of C. elegans microRNAs.
Lehrbach NJ, Miska EA. Lehrbach NJ, et al. Brief Funct Genomic Proteomic. 2008 May;7(3):228-35. doi: 10.1093/bfgp/eln024. Epub 2008 Jun 19. Brief Funct Genomic Proteomic. 2008. PMID: 18565984 Review.
Cited by
- Use of somatic mutations to quantify random contributions to mouse development.
Zhou W, Tan Y, Anderson DJ, Crist EM, Ruohola-Baker H, Salipante SJ, Horwitz MS. Zhou W, et al. BMC Genomics. 2013 Jan 18;14:39. doi: 10.1186/1471-2164-14-39. BMC Genomics. 2013. PMID: 23327737 Free PMC article. - The Diathesis-Epilepsy Model: How Past Events Impact the Development of Epilepsy and Comorbidities.
Bernard C. Bernard C. Cold Spring Harb Perspect Med. 2016 Jun 1;6(6):a022418. doi: 10.1101/cshperspect.a022418. Cold Spring Harb Perspect Med. 2016. PMID: 27194167 Free PMC article. Review. - Maps of variability in cell lineage trees.
Hicks DG, Speed TP, Yassin M, Russell SM. Hicks DG, et al. PLoS Comput Biol. 2019 Feb 12;15(2):e1006745. doi: 10.1371/journal.pcbi.1006745. eCollection 2019 Feb. PLoS Comput Biol. 2019. PMID: 30753182 Free PMC article. - How to talk about genome editing.
Starr S. Starr S. Br Med Bull. 2018 Jun 1;126(1):5-12. doi: 10.1093/bmb/ldy015. Br Med Bull. 2018. PMID: 29697749 Free PMC article. - Cell type evolution reconstruction across species through cell phylogenies of single-cell RNA sequencing data.
Mah JL, Dunn CW. Mah JL, et al. Nat Ecol Evol. 2024 Feb;8(2):325-338. doi: 10.1038/s41559-023-02281-9. Epub 2024 Jan 5. Nat Ecol Evol. 2024. PMID: 38182680
References
- Sulston JE, Schierenberg E, White JG, Thomson JN. The embryonic cell lineage of the nematode Caenorhabditis elegans . Dev Biol. 1983;100:64–119. - PubMed
- Stern CD, Fraser SE. Tracing the lineage of tracing cell lineages. Nat Cell Biol. 2001;3:E216–E218. - PubMed
- Clarke JD, Tickle C. Fate maps old and new. Nat Cell Biol. 1999;1:E103–E109. - PubMed
- Noctor SC, Flint AC, Weissman TA, Dammerman RS, Kriegstein AR. Neurons derived from radial glial cells establish radial units in neocortex. Nature. 2001;409:714–720. - PubMed
- Ardavin C, Martinez del Hoyo G, Martin P, Anjuere F, Arias CF, et al. Origin and differentiation of dendritic cells. Trends Immunol. 2001;22:691–700. - PubMed
Publication types
MeSH terms
LinkOut - more resources
Full Text Sources
Other Literature Sources


