Cholinergic inhibition of neocortical pyramidal neurons - PubMed (original) (raw)
Comparative Study
Cholinergic inhibition of neocortical pyramidal neurons
Allan T Gulledge et al. J Neurosci. 2005.
Abstract
Acetylcholine (ACh) is a central neurotransmitter critical for normal cognitive function. Here we show that transient muscarinic acetylcholine receptor activation directly inhibits neocortical layer 5 pyramidal neurons. Using whole-cell and cell-attached recordings from neurons in slices of rat somatosensory cortex, we demonstrate that transient activation of M1-type muscarinic receptors induces calcium release from IP3-sensitive intracellular calcium stores and subsequent activation of an apamin-sensitive, SK-type calcium-activated potassium conductance. ACh-induced hyperpolarizing responses were blocked by atropine and pirenzepine but not by methoctramine or GABA receptor antagonists (picrotoxin, SR 95531 [2-(3-carboxypropyl)-3-amino-6-(4-methoxyphenyl)pyridazinium bromide], and CGP 55845 [(2S)-3-[[(15)-1-(3,4-dichlorophenyl)ethyl]amino-2-hydroxypropyl](phenylmethyl)phosphinic acid]). Responses were associated with a 31 +/- 5% increase in membrane conductance, had a reversal potential of -93 +/- 1 mV, and were eliminated after internal calcium chelation with BAPTA, blockade of IP3 receptors, or extracellular application of cadmium but not by sodium channel blockade with tetrodotoxin. Calcium-imaging experiments demonstrated that ACh-induced hyperpolarizing, but not depolarizing, responses were correlated with large increases in intracellular calcium. Surprisingly, transient increases in muscarinic receptor activation were capable of generating hyperpolarizing responses even during periods of tonic muscarinic activation sufficient to depolarize neurons to action potential threshold. Furthermore, eserine, an acetylcholinesterase inhibitor similar to those used therapeutically in the treatment of Alzheimer's disease, disproportionately enhanced the excitatory actions of acetylcholine while reducing the ability of acetylcholine to generate inhibitory responses during repeated applications of ACh. These data demonstrate that acetylcholine can directly inhibit the output of neocortical pyramidal neurons.
Figures
Figure 1.
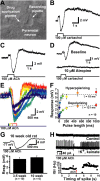
Transient muscarinic receptor activation hyperpolarizes cortical pyramidal neurons. A, Image of experimental setup showing a layer 5 pyramidal neuron and the position of recording and drug-delivery pipettes. B-D, Focal applications of carbachol (B) or acetylcholine (C) produce biphasic, hyperpolarizing and depolarizing, responses that are atropine sensitive (D). E, Superimposed responses of a layer 5 pyramidal neuron to ACh applications of varying duration (5, 10, 20, 50, 100, 200, 500, and 1000 ms). F, Plot of the mean peak hyperpolarizing and depolarizing responses produced by variable durations of ACh exposure (n = 10). Dashed lines indicate exponential fits to the averaged data from 10 neurons. The time constants of the averaged data were 18 ms for hyperpolarizing responses and 121 ms for depolarizing responses. G, Hyperpolarizing responses to ACh (50 ms) recorded in pyramidal neurons in somatosensory slices from adult (10-week-old) rats (top), and a summary graph comparing responses in younger and older animals (bottom). H, Extracellular recordings of responses to focal ACh application (20 ms) in a neuron before and after exposure to increased extracellular potassium (6 m
m
) and kainate (200 n
m
). Below is a plot of the instantaneous spike frequency (ISI) for this neuron showing the ACh-induced inhibition.
Figure 2.
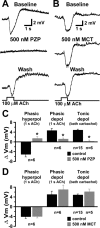
Cholinergic inhibition results from M1 receptor activation. A, Responses of a layer 5 neuron to transient ACh application (1 s) in control conditions (top trace) and after a 5 min bath application of the M1 receptor antagonist PZP (500 n
m
; middle trace). The response partially returns after a 20 min wash in control aCSF (bottom trace). B, Cholinergic responses before (top trace), during (middle trace), and after (bottom trace) a 5 min bath application of the M2 receptor antagonist MCT (500 n
m
). C, Summary graph showing the effects of PZP on hyperpolarizing and depolarizing responses to 1-s-long ACh applications (n = 6), as well as on tonic depolarization generated by a 5 min bath application of carbachol (10 μ
m
; n = 15 in control condition; n = 6 in PZP). D, Summary graph showing the effects of MCT on hyperpolarizing and depolarizing responses to 1-s-long ACh applications (n = 6), as well as on tonic depolarization generated by a 5 min bath application of carbachol (10 μ
m
; n = 5 in MCT). Control cells for bath-applied carbachol data are the same for C and D.
Figure 3.
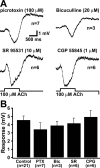
Transient cholinergic inhibition is not mediated by a GABAergic mechanism. A, Responses of pyramidal neurons to focal application of ACh (100 μ
m
; 1 s) in the presence of a variety of GABAergic antagonists: picrotoxin (PTX; top left), bicuculline (Bic; top right), SR 95531 (SR; bottom left), and CGP 55845 (CGP; bottom right). B, A summary graph comparing the peak amplitudes of hyperpolarizing responses to ACh in control neurons (n = 21) with the peak amplitude of responses to ACh in the presence of the different GABAergic antagonists. All data from 1-s-long applications of ACh.
Figure 4.
Calcium entry during trains of action potentials facilitates hyperpolarizing responses to transient mAChR activation. A, Repeated application of ACh (20 ms applications at 8 s intervals) produces a gradual rundown of the hyperpolarizing response (bottom trace, expanded below for clarity). Repeating the protocol during a train of action potentials generated by a 400 pA current injection (top trace) facilitates phasic hyperpolarizing responses. B, Responses to repetitive ACh application (20 ms at 8 s intervals) in a neuron exposed to 1 μ
m
TTX at -60 mV (bottom black trace) and during strong depolarization (top black trace). Subsequent bath application of cadmium (200 μ
m
) caused significant rundown at the depolarized potential (blue trace), an effect that was partially reversed after 20 min wash in regular aCSF (red trace). C, Summary graph comparing the amplitude of hyperpolarizing responses for each of five ACh applications in control cells at rest and when depolarized (circles; n = 9), in a separate group of neurons exposed to 1 μ
m
TTX at -60 mV and during strong depolarization (triangles; n = 11), and a subset of neurons transiently exposed to cadmium (diamonds; n = 10; n = 5 for wash). D, Bath application of cadmium chloride (200 μ
m
) in the absence of TTX reversibly eliminates the hyperpolarizing response to a 40 ms ACh application at resting potentials.
Figure 5.
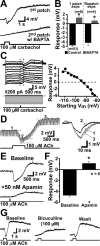
Hyperpolarizing responses to transient mAChR stimulation result from the activation of an SK-type calcium-activated potassium conductance. A, Responses of a pyramidal neuron to transient carbachol application when patched with normal internal pipette solution (top trace) and after being patched a second time with a pipette containing the calcium-chelating agent BAPTA (10 m
m
; bottom trace). B, Summary graph showing effectiveness of internal BAPTA in blocking cholinergic responses. The left two bars show a comparison of responses to 1-s-long applications of carbachol or ACh in control conditions (n = 51) and in cells patched a single time with BAPTA (10 μ
m
) in the pipette (n = 6). Right two bars compare responses to carbachol (1 s) in control conditions and after repatching with a BAPTA-containing pipette (10 μ
m
; n = 4). C, Responses to a 40 ms application of carbachol (100 μ
m
; top) from different starting potentials generated by somatic current injection (bottom). Right, A plot of peak response versus starting potential indicates a reversal potential of -94 mV. D, ACh-induced hyperpolarizations are associated with an increased membrane conductance. The membrane response to repetitive current injections is shown during the focal application of ACh (1 s). Thick dashed lines indicate the amplitude of membrane responses to somatic current steps in baseline conditions (shown again during the depolarizing phase of the Ach response for comparison). Thin dotted lines show the amplitude of responses to current injection during the peak of the ACh-induced hyperpolarization. To the right are enlarged traces of individual hyperpolarizing pulses generated before (1), during (2), and after (3) application of ACh. E, The application of the SK-type potassium channel blocker apamin irreversibly blocks the hyperpolarizing response to transient mAChR activation (40 ms). F, Summary graph showing that apamin completely blocks ACh-induced hyperpolarizations. G, Bath application of 100 μ
m
bicuculline methiodide, an SK channel antagonist at high concentrations, reversibly blocks hyperpolarizing responses to ACh.
Figure 6.
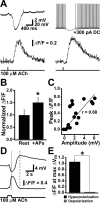
Calcium-imaging experiments demonstrate a rise in internal calcium that is correlated with the timing and magnitude of hyperpolarizing responses to ACh. A, Voltage (top) and optical (Δ_F_/F; bottom) responses of a pyramidal neuron to a 5 ms application of ACh at rest (left) and during a train of action potentials generated by somatic current injection (right). DC, Direct current. B, Summary data showing that the peak Δ_F_/F is larger when generated during action potential (AP) firing (n = 5). C, Plot of the correlation between peak Δ_F_/F and the magnitude of the hyperpolarizing response from rest. Data are from multiple trials in five neurons experiencing ACh applications of 5-20 ms duration. D, The membrane response (top) and Δ_F_/F measured from a line scan across the soma (bottom) during a 1-s-long application of ACh. Traces are the average of five consecutive ACh applications. The dotted line shows timing of peak hyperpolarization, and the dashed line demarks peak depolarization. E, Summary graph comparing Δ_F_/F values at the peak of the depolarizing and hyperpolarizing phases of responses to 1-s-long applications of ACh (n = 4).
Figure 7.
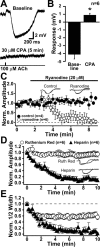
Transient mAChR activation leads to calcium release from IP3-sensitive stores. A, Response to a 20 ms application of ACh in control conditions (top) and after a 5 min bath application of CPA. B, Summary data from six experiments in which CPA was applied. Hyperpolarizing responses were completely eliminated after 5 min exposure to CPA. C, Plot of normalized peak hyperpolarizing response amplitude for ACh applications given at 15 s intervals in control conditions (filled circles) and after bath application of ryanodine (20 μ
m
; open circles). Insets, Superimposed traces of from the beginning (black) and end (gray) of the experiment for control and ryanodine-exposed neurons. D, E, Patching neurons with pipettes filled with either the ryanodine receptor antagonist ruthenium red (open circles) or the IP3 receptor antagonist heparin (filled triangles) demonstrates that the peak amplitude of hyperpolarizing responses depends solely on IP3 receptor activation (D), whereas activation of ryanodine receptors can prolong response half-width (E). Insets, The first (black) and last (gray) traces superimposed for cells patched with heparin or ruthenium red.
Figure 8.
Coexistence of phasic inhibition with excitation from tonic mAChR activation. A, Hyperpolarizing responses to focal ACh applications (20 ms) before (top trace), during (middle trace), and after (bottom trace) wash of 5 μ
m
bath-applied carbachol. B, A train of five applications of ACh (20 ms duration, 0.125 Hz) produces hyperpolarizing responses in baseline conditions (top trace). Although bath application of carbachol (5 μ
m
) paired with several conditioning depolarizing pulses depolarized the neuron and induced spontaneous action potential generation, transient ACh application continued to produce hyperpolarizing responses during tonic firing (middle trace). The effect of ACh is still present after the removal of carbachol from the bath (bottom trace).
Figure 9.
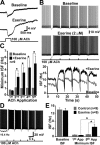
Impact of an acetylcholinesterase inhibitor on mAChR responses. A, Responses to single applications of ACh (1 s) in control conditions (top trace) and after bath application of eserine (2 μ
m
; bottom trace). B, Responses to repeated ACh applications (20 ms, 8 s intervals) during action potential firing (+350 pA somatic current injection) before (top trace) and during (bottom trace) bath application of eserine. Bottom, Plots of the ISF showing the reduction in ISF for each of the five ACh applications in baseline conditions (gray trace) and in eserine (black trace). C, Summary graph showing the mean minimum ISF attained during each of five ACh applications before (gray) and in eserine (black; n = 9). D, Responses to ACh applications (20 ms) to a cell firing action potentials with a high ISF (mean ISF, 16.4 Hz) attained by somatic current injection (450 pA). E, Summary graph comparing initial ISFs, as well as minimum ISFs attained during the first and fifth ACh application, in control neurons (n = 9) and neurons exposed to eserine (2 μ
m
; n = 9; eserine data from neurons shown in B and C). Significant changes in the minimum ISF were observed only in eserine-treated neurons.
Similar articles
- Phasic cholinergic signaling in the hippocampus: functional homology with the neocortex?
Gulledge AT, Kawaguchi Y. Gulledge AT, et al. Hippocampus. 2007;17(5):327-32. doi: 10.1002/hipo.20279. Hippocampus. 2007. PMID: 17407133 - A unifying hypothesis for M1 muscarinic receptor signalling in pyramidal neurons.
Dasari S, Hill C, Gulledge AT. Dasari S, et al. J Physiol. 2017 Mar 1;595(5):1711-1723. doi: 10.1113/JP273627. Epub 2016 Dec 17. J Physiol. 2017. PMID: 27861914 Free PMC article. - Heterogeneity of phasic cholinergic signaling in neocortical neurons.
Gulledge AT, Park SB, Kawaguchi Y, Stuart GJ. Gulledge AT, et al. J Neurophysiol. 2007 Mar;97(3):2215-29. doi: 10.1152/jn.00493.2006. Epub 2006 Nov 22. J Neurophysiol. 2007. PMID: 17122323 - Ionic mechanism of the slow afterdepolarization induced by muscarinic receptor activation in rat prefrontal cortex.
Haj-Dahmane S, Andrade R. Haj-Dahmane S, et al. J Neurophysiol. 1998 Sep;80(3):1197-210. doi: 10.1152/jn.1998.80.3.1197. J Neurophysiol. 1998. PMID: 9744932 - Spatiotemporal specificity in cholinergic control of neocortical function.
Muñoz W, Rudy B. Muñoz W, et al. Curr Opin Neurobiol. 2014 Jun;26:149-60. doi: 10.1016/j.conb.2014.02.015. Epub 2014 Mar 15. Curr Opin Neurobiol. 2014. PMID: 24637201 Free PMC article. Review.
Cited by
- Data-Driven Modeling of Cholinergic Modulation of Neural Microcircuits: Bridging Neurons, Synapses and Network Activity.
Ramaswamy S, Colangelo C, Markram H. Ramaswamy S, et al. Front Neural Circuits. 2018 Oct 9;12:77. doi: 10.3389/fncir.2018.00077. eCollection 2018. Front Neural Circuits. 2018. PMID: 30356701 Free PMC article. - Perisomatic Inhibition and Its Relation to Epilepsy and to Synchrony Generation in the Human Neocortex.
Tóth EZ, Szabó FG, Kandrács Á, Molnár NO, Nagy G, Bagó AG, Erőss L, Fabó D, Hajnal B, Rácz B, Wittner L, Ulbert I, Tóth K. Tóth EZ, et al. Int J Mol Sci. 2021 Dec 24;23(1):202. doi: 10.3390/ijms23010202. Int J Mol Sci. 2021. PMID: 35008628 Free PMC article. - Synaptic Release of Acetylcholine Rapidly Suppresses Cortical Activity by Recruiting Muscarinic Receptors in Layer 4.
Dasgupta R, Seibt F, Beierlein M. Dasgupta R, et al. J Neurosci. 2018 Jun 6;38(23):5338-5350. doi: 10.1523/JNEUROSCI.0566-18.2018. Epub 2018 May 8. J Neurosci. 2018. PMID: 29739869 Free PMC article. - Cell-specific modulation of plasticity and cortical state by cholinergic inputs to the visual cortex.
Sugihara H, Chen N, Sur M. Sugihara H, et al. J Physiol Paris. 2016 Sep;110(1-2):37-43. doi: 10.1016/j.jphysparis.2016.11.004. Epub 2016 Nov 10. J Physiol Paris. 2016. PMID: 27840211 Free PMC article. Review. - Cholinergic Behavior State-Dependent Mechanisms of Neocortical Gain Control: a Neurocomputational Study.
Puigbò JY, Maffei G, Herreros I, Ceresa M, González Ballester MA, Verschure PFMJ. Puigbò JY, et al. Mol Neurobiol. 2018 Jan;55(1):249-257. doi: 10.1007/s12035-017-0737-6. Mol Neurobiol. 2018. PMID: 28965244
References
- Andrade R (1991) Cell excitation enhances muscarinic cholinergic responses in rat association cortex. Brain Res 548: 81-93. - PubMed
- Bandrowski AE, Moore SL, Ashe JH (2001) Cholinergic synaptic potentials in the supragranular layers of auditory cortex. Synapse 41: 118-130. - PubMed
- Bartus RT, Dean III RL, Beer B, Lippa AS (1982) The cholinergic hypothesis of geriatric memory dysfunction. Science 217: 408-414. - PubMed
- Blitzer RD, Gil O, Landau EM (1990) Cholinergic stimulation enhances long-term potentiation in the CA1 region of rat hippocampus. Neurosci Lett 119: 207-210. - PubMed
- Buresova O, Bolhuis JJ, Bures J (1986) Differential effects of cholinergic blockade on performance of rats in the water tank navigation task and in a radial water maze. Behav Neurosci 100: 476-482. - PubMed
Publication types
MeSH terms
Substances
LinkOut - more resources
Full Text Sources
Other Literature Sources
Research Materials
