Different Plk1 functions show distinct dependencies on Polo-Box domain-mediated targeting - PubMed (original) (raw)
Different Plk1 functions show distinct dependencies on Polo-Box domain-mediated targeting
Anja Hanisch et al. Mol Biol Cell. 2006 Jan.
Abstract
Polo-like kinase 1 (Plk1) has multiple important functions during M-phase progression. In addition to a catalytic domain, Plk1 possesses a phosphopeptide-binding motif, the polo-box domain (PBD), which is required for proper localization. Here, we have explored the importance of correct Plk1 subcellular targeting for its mitotic functions. We either displaced endogenous Plk1 through overexpression of the PBD or introduced the catalytic domain of Plk1, lacking the PBD, into Plk1-depleted cells. Both treatments resulted in remarkably similar phenotypes, which were distinct from the Plk1 depletion phenotype. Cells depleted of Plk1 mostly arrested with monoastral spindles, because of inhibition of centrosome maturation and separation. In contrast, these functions were not impaired in cells with mislocalized Plk1. Instead, these latter cells showed a checkpoint-dependent mitotic arrest characterized by impaired chromosome congression. Thus, whereas chromosome congression requires localized Plk1 activity, other investigated Plk1 functions are less dependent on correct PBD-mediated targeting. This opens the possibility that PBD-directed drugs might be developed to selectively interfere with a subset of Plk1 functions.
Figures
Figure 1.
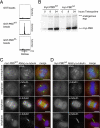
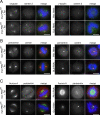
Localization of the Plk1 PBD to diverse spindle structures requires an intact phosphopeptide-binding motif. (A) In vitro analysis of phosphopeptide binding to GST-PBDWT-, GST-PBDAA-, and control (GST)-coated glutathione-Sepharose beads. Phosphopeptide binding was determined by MS. Only with GST-PBDWT, a phosphopeptide (PBDtide) of the correct m/z ratio, was detected. (B) Expression analysis of Plk1 PBDWT and PBDAA in stable cell lines induced with tetracycline for the indicated time durations. Equal amounts of cell lysates were probed with anti-Plk1 antibody after Western blotting. Endogenous Plk1 and the expressed myc-tagged Plk1 PBDs are indicated. (C) Myc-PBDWT and (D) myc-PBDAA stable cell lines were induced for 8 h with tetracycline and then fixed and permeabilized with formaldehyde/Triton X-100, or -20°C methanol for γ-tubulin staining. Cells were analyzed by indirect immunofluorescence microscopy using anti-myc-tetramethylrhodamine B isothiocyanate (red); DAPI (blue); and either ANA autoimmune serum (green), anti-γ-tubulin (green), or anti-α-tubulin (green) antibodies to reveal colocalization with kinetochores, centrosomes, and spindle microtubules, respectively. Merged pictures are shown at the right. Bars, 10 μm.
Figure 2.
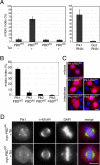
Overexpression of the Plk1 PBDWT results in endogenous Plk1 displacement and mitotic arrest. (A) Mitotic indexes of PBDWT and PBDAA stable cell lines after treatment for 24 h with (Tet+) or without (Tet-) tetracycline (left graph). The mitotic indexes of cells treated for 36 h with Plk1 and control (GL2) siRNA duplexes are also shown (right graph). The mitotic indexes were determined by immunofluorescence microscopic analysis of the stained DNA. Histograms show results of three independent experiments (300-500 cells each), and bars indicate standard deviations. (B) Mitotic indexes of cells transiently transfected with myc-tagged PBDWT and the PBDAA mutant form of Plk1 as well as the wild-type PBDs of Plk2 and Plk3, respectively. After 48 h of transient transfection, cells were fixed and permeabilized with formaldehyde/Triton X-100 and stained with anti-myc antibody (9E10-tetramethylrhodamine B isothiocyanate) and DAPI. The mitotic indexes of the transfected (myc-positive) cells were then determined by immunofluorescence microscopic analysis of the stained DNA. Histograms show results of three independent experiments (>200 cells each), and bars indicate standard deviations. (C) Immunofluorescence images of cells expressing the indicated myc-tagged Plk-PBD constructs. Cells were treated as described in B. (D) PBDWT and PBDAA stable cell lines were induced for 24 h with tetracycline and subsequently fixed and permeabilized with formaldehyde/Triton X-100. Cells were then analyzed by indirect immunofluorescence microscopy using an anti-Plk1 N-terminal antibody (red), an anti-α-tubulin antibody (green) and DAPI (blue). Bars, 10 μm.
Figure 3.
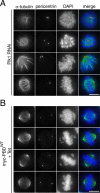
The mitotic phenotype of PBDWT-expressing cells is distinct from the phenotype of Plk1-depleted cells. (A) HeLa S3 cells were treated with Plk1 siRNA duplexes for 36 h. After fixation and permeabilization, cells were analyzed by indirect immunofluorescence microscopy using anti-pericentrin (red), anti-α-tubulin (green) antibodies, and DAPI (blue) staining. (B) The myc-PBDWT stable cell line was induced for 24 h with tetracycline. Cells were fixed, stained, and analyzed as described in A. Bars, 10 μm.
Figure 4.
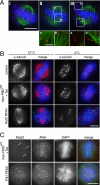
Lack of proper kinetochore-microtubule attachments on unaligned chromosomes in PBDWT-expressing cells. (A) Myc-PBDWT induced cells were fixed and permeabilized with formaldehyde/Triton X-100 and then stained with anti-α-tubulin (green), Hec1 (red), and DAPI (blue). A series of Z-stack images was taken from a mitotic cell and subsequently deconvolved. The left panel (I) shows a projection of the total Z-stack, whereas the middle (II) and right panels (III) show separate Z-stacks of the same cell (bar, 10 μm). Higher magnifications of the boxes indicated in II and III are presented below (bar, 5 μm). (B) The myc-PBDWT stable cell line (middle row) was induced for 24 h with tetracycline and HeLa S3 cells (bottom panel) were treated with Nuf2 siRNA duplexes for 48 h. These cells, as well as control GL2-treated cells (top row), were then incubated for 10 min on ice followed by fixation and permeabilization with formaldehyde/Triton X-100. Cells were analyzed by indirect immunofluorescence microscopy using anti-α-tubulin antibody (red), CREST autoimmune serum (green), and DAPI (blue). (C) The myc-PBDWT stable cell line (top row) was induced for 24 h with tetracycline, and HeLa S3 cells (bottom row) were treated with Plk1 siRNA duplexes for 36 h. After formaldehyde/Triton X-100 fixation, cells were analyzed by indirect immunofluorescence microscopy using anti-Mad2 antibody (red), ANA autoimmune serum (green), and DAPI (blue) staining. Arrows indicate Mad2 positive kinetochores at uncongressed chromosomes. Bars, 10 μm.
Figure 5.
Centrosome maturation defects in Plk1-depleted but not PBDWT-induced cells. (A) The myc-PBDWT stable cell line (left) was induced (+Tet) for 24 h with tetracycline or left untreated (-Tet). HeLa S3 cells (right) were either treated with Plk1 or control (GL2) siRNA duplexes for 36 h. After -20°C methanol fixation, cells were analyzed by indirect immunofluorescence microscopy using anti-γ-tubulin (green), anti-centrin antibodies (red), and DAPI (blue) staining. (B) Same as in A, but cells were analyzed after anti-pericentrin (red), anti-centrin (green), and DAPI (blue) staining. (C) Same as in A, but cells were fixed and permeabilized with formaldehyde/Triton X-100 and analyzed after anti-Aurora-A (green) and anti-pericentrin (red), and DAPI (blue) staining. Bars, 10 μm.
Figure 6.
Chromosome spreads display dissociated chromosome arms in PBDWT-induced but not Plk1-depleted cells. Mitotic myc-PBDWT cells were obtained by tetracycline induction of the stable cell line for 24 h (left). HeLa S3 cells were either arrested in mitosis by siRNA-mediated Plk1 depletion (middle) for 36 h or by nocodazole treatment for 14 h (right). Mitotic chromosome spreads of all cells were stained with DAPI. Bar, 10 μm.
Figure 7.
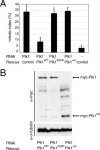
Expression of only the Plk1 catalytic domain in a Plk1-depleted background is not sufficient to overcome mitotic arrest. (A) HeLa S3 cells were cotransfected for 40 h with an empty RNAi vector (-) or an insert targeting Plk1, together with protein expression vectors (Rescue) coding for different myc-tagged Plk1 constructs or a myc-tagged control protein, as indicated. Cells were fixed and permeabilized with formaldehyde/Triton X-100 and were stained with anti-pericentrin antibody, anti-myc 9E10 antibody, and DAPI. The mitotic indexes were determined as in Figure 2B. Histogram shows the results of three independent experiments (300-500 cells each), and bars indicate standard deviations. (B) Expression levels of the different myc-tagged Plk1 proteins (Rescue) were analyzed by Western blotting using the anti-myc 9E10 antibody, and detection of α-tubulin was used as a loading control.
Figure 8.
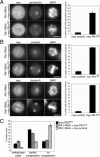
The PBD is dispensable for centrosome maturation and separation but required for chromosome congression. (A) HeLa S3 cells were cotransfected for 40 h with a Plk1-targeting RNAi vector and plasmids coding for either a myc-control protein or the myc-Plk1 catalytic domain. Cells were fixed and permeabilized with formaldehyde/Triton X-100 and then stained with anti-myc 9E10 antibody, DAPI, and anti-pericentrin antibody to visualize centrosome separation. Histogram shows the quantification of cells with separated centrosomes. Centrosomes were regarded as separated if they were positioned at opposite sites of the chromosome masses. Results are of three independent experiments (>100 cells each), and bars indicate standard deviations. (B) Same as in A, but cells were either fixed and permeabilized with -20°C methanol and stained with anti-myc 9E10 antibody, anti-γ-tubulin antibody, and DAPI (top) or fixed and permeabilized with formaldehyde/Triton X-100 and stained with anti-myc 9E10 antibody, anti-Auro-ra-A antibody and DAPI (bottom). Histograms show the quantification of the recruitment of γ-tubulin and Aurora-A, respectively. Results are of three independent experiments (>50 cells each), and bars indicate standard deviations. (C). Histogram shows quantification of the different degrees of chromosome congression to the metaphase plate in PBDWT-expressing cells (black bars), in cells expressing the Plk1 catalytic domain in a Plk1-depleted background (dark gray bars), and in Plk1-depleted cells (light gray bars). The term “partial congression” is used to describe cells in which a metaphase-like plate is present together with variable numbers of uncongressed chromosomes, whereas “no congression” describes cells that do not show an obvious metaphase plate. Results are of three independent experiments (100 cells each), and bars indicate standard deviations. Bars, 10 μm.
Similar articles
- Deficiency in chromosome congression by the inhibition of Plk1 polo box domain-dependent recognition.
Watanabe N, Sekine T, Takagi M, Iwasaki J, Imamoto N, Kawasaki H, Osada H. Watanabe N, et al. J Biol Chem. 2009 Jan 23;284(4):2344-53. doi: 10.1074/jbc.M805308200. Epub 2008 Nov 25. J Biol Chem. 2009. PMID: 19033445 - High mitotic activity of Polo-like kinase 1 is required for chromosome segregation and genomic integrity in human epithelial cells.
Lera RF, Burkard ME. Lera RF, et al. J Biol Chem. 2012 Dec 14;287(51):42812-25. doi: 10.1074/jbc.M112.412544. Epub 2012 Oct 27. J Biol Chem. 2012. PMID: 23105120 Free PMC article. - Mechanisms of mammalian polo-like kinase 1 (Plk1) localization: self- versus non-self-priming.
Lee KS, Park JE, Kang YH, Zimmerman W, Soung NK, Seong YS, Kwak SJ, Erikson RL. Lee KS, et al. Cell Cycle. 2008 Jan 15;7(2):141-5. doi: 10.4161/cc.7.2.5272. Epub 2007 Oct 16. Cell Cycle. 2008. PMID: 18216497 - Mechanisms underlying Plk1 polo-box domain-mediated biological processes and their physiological significance.
Lee KS, Park JE, Kang YH, Kim TS, Bang JK. Lee KS, et al. Mol Cells. 2014 Apr;37(4):286-94. doi: 10.14348/molcells.2014.0002. Epub 2014 Apr 7. Mol Cells. 2014. PMID: 24722413 Free PMC article. Review. - Plk1-targeted small molecule inhibitors: molecular basis for their potency and specificity.
Murugan RN, Park JE, Kim EH, Shin SY, Cheong C, Lee KS, Bang JK. Murugan RN, et al. Mol Cells. 2011 Sep;32(3):209-20. doi: 10.1007/s10059-011-0126-3. Epub 2011 Jul 29. Mol Cells. 2011. PMID: 21809214 Free PMC article. Review.
Cited by
- Plk5, a polo box domain-only protein with specific roles in neuron differentiation and glioblastoma suppression.
de Cárcer G, Escobar B, Higuero AM, García L, Ansón A, Pérez G, Mollejo M, Manning G, Meléndez B, Abad-Rodríguez J, Malumbres M. de Cárcer G, et al. Mol Cell Biol. 2011 Mar;31(6):1225-39. doi: 10.1128/MCB.00607-10. Epub 2011 Jan 18. Mol Cell Biol. 2011. PMID: 21245385 Free PMC article. - Structural Basis for Variations in Polo-like Kinase 1 Conformation and Intracellular Stability Induced by ATP-Competitive and Novel Noncompetitive Abbapolin Inhibitors.
Chapagai D, Merhej G, McInnes C, Wyatt MD. Chapagai D, et al. ACS Chem Biol. 2023 Jul 21;18(7):1642-1652. doi: 10.1021/acschembio.3c00269. Epub 2023 Jul 11. ACS Chem Biol. 2023. PMID: 37433100 Free PMC article. - Decoding Polo-like kinase 1 signaling along the kinetochore-centromere axis.
Lera RF, Potts GK, Suzuki A, Johnson JM, Salmon ED, Coon JJ, Burkard ME. Lera RF, et al. Nat Chem Biol. 2016 Jun;12(6):411-8. doi: 10.1038/nchembio.2060. Epub 2016 Apr 4. Nat Chem Biol. 2016. PMID: 27043190 Free PMC article. - Structure-function relationship of the Polo-like kinase in Trypanosoma brucei.
Yu Z, Liu Y, Li Z. Yu Z, et al. J Cell Sci. 2012 Mar 15;125(Pt 6):1519-30. doi: 10.1242/jcs.094243. Epub 2012 Jan 24. J Cell Sci. 2012. PMID: 22275435 Free PMC article. - The Plk1-dependent phosphoproteome of the early mitotic spindle.
Santamaria A, Wang B, Elowe S, Malik R, Zhang F, Bauer M, Schmidt A, Silljé HH, Körner R, Nigg EA. Santamaria A, et al. Mol Cell Proteomics. 2011 Jan;10(1):M110.004457. doi: 10.1074/mcp.M110.004457. Epub 2010 Sep 22. Mol Cell Proteomics. 2011. PMID: 20860994 Free PMC article.
References
- Arnaud, L., Pines, J., and Nigg, E. A. (1998). GFP tagging reveals human Polo-like kinase 1 at the kinetochore/centromere region of mitotic chromosomes. Chromosoma 107, 424-429. - PubMed
- Barr, F. A., Sillje, H. H., and Nigg, E. A. (2004). Polo-like kinases and the orchestration of cell division. Nat. Rev. Mol. Cell. Biol. 5, 429-440. - PubMed
- Berdnik, D., and Knoblich, J. A. (2002). Drosophila Aurora-A is required for centrosome maturation and actin-dependent asymmetric protein localization during mitosis. Curr. Biol. 12, 640-647. - PubMed
- Brummelkamp, T. R., Bernards, R., and Agami, R. (2002). A system for stable expression of short interfering RNAs in mammalian cells. Science 296, 550-553. - PubMed
Publication types
MeSH terms
Substances
LinkOut - more resources
Full Text Sources
Other Literature Sources
Research Materials
Miscellaneous
