Suppression of allergic airway inflammation by helminth-induced regulatory T cells - PubMed (original) (raw)
Suppression of allergic airway inflammation by helminth-induced regulatory T cells
Mark S Wilson et al. J Exp Med. 2005.
Abstract
Allergic diseases mediated by T helper type (Th) 2 cell immune responses are rising dramatically in most developed countries. Exaggerated Th2 cell reactivity could result, for example, from diminished exposure to Th1 cell-inducing microbial infections. Epidemiological studies, however, indicate that Th2 cell-stimulating helminth parasites may also counteract allergies, possibly by generating regulatory T cells which suppress both Th1 and Th2 arms of immunity. We therefore tested the ability of the Th2 cell-inducing gastrointestinal nematode Heligmosomoides polygyrus to influence experimentally induced airway allergy to ovalbumin and the house dust mite allergen Der p 1. Inflammatory cell infiltrates in the lung were suppressed in infected mice compared with uninfected controls. Suppression was reversed in mice treated with antibodies to CD25. Most notably, suppression was transferable with mesenteric lymph node cells (MLNC) from infected animals to uninfected sensitized mice, demonstrating that the effector phase was targeted. MLNC from infected animals contained elevated numbers of CD4(+)CD25(+)Foxp3(+) T cells, higher TGF-beta expression, and produced strong interleukin (IL)-10 responses to parasite antigen. However, MLNC from IL-10-deficient animals transferred suppression to sensitized hosts, indicating that IL-10 is not the primary modulator of the allergic response. Suppression was associated with CD4(+) T cells from MLNC, with the CD4(+)CD25(+) marker defining the most active population. These data support the contention that helminth infections elicit a regulatory T cell population able to down-regulate allergen induced lung pathology in vivo.
Figures
Figure 1.
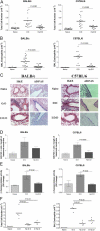
Airway cell infiltration and tissue pathology are inhibited in _H. polygyrus_-infected mice. BALB/c or C57BL/6 mice were sensitized to OVA or Der p 1, respectively, by two i.p. injections of 10 μg of allergen adsorbed to Alum; 14 and 17 d after the second sensitization, mice were given soluble allergen by direct tracheal inoculation. Lavage cells were recovered 24 h after final airway challenge (day 31), and histological sections made of lung tissues. O:O denotes OVA sensitized (day 0 and 14), and challenged (day 28 and 30). D:D denotes Der p 1 sensitized (day 0 and 14), and challenged (day 28 and 30). Cells were harvested at day 31. Hp:O:O and Hp:D:D are mice infected with H. polygyrus 28 d before allergen sensitization; D:Hp:D are mice infected 14 d after sensitization, but before challenge. (A) Total lavage cell numbers. Data represent means and individual data from four experiments (18–20 mice per group) using the same protocol. Horizontal bars denote paired experimental groups for which statistical significance is displayed in the figure. (B) Eosinophil numbers. All four experiments displayed significant reductions in airway eosinophilia in infected-allergen challenged animals compared with uninfected allergen challenged littermates. (C) Formalin-fixed lung 5-μm sections from naive, allergic, and infected-allergic mice stained with hematoxylin and eosin (H&E) for nuclear staining of infiltrating cells or stained with AB-PAS for mucin-producing goblet cell numbers. (D) Enumeration of goblet cells, stained with AB-PAS in the three groups of mice. Data represent mean and SEM of five mice, with a mean score from three representative lung sections per mouse. (E) β-Hexosaminidase in BALF of allergic and infected mice. (F) Total cells and eosinophils in mice infected before or after allergen sensitization.
Figure 2.
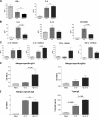
Bronchio-alveolar lavage cytokine responses. BALF from naive, allergic, and infected-allergic mice assayed for the indicated cytokines and eotaxin. Data are from individual mice, with arithmetic mean points shown in histograms. In cases where responses are similar in BALB/c and C57BL/6 mice, data are shown only from the BALB/c response to OVA. (A) IFN-γ and IL-4, in BALB/c mice; (B) IL-5, IL-13, and eotaxin in BALB/c mice; (C) IL-10 and TGF-β in BALB/c and C57BL/6 mice. (D) Allergen- specific serum IgG1 and IgG2a titers 1 d after the final airway challenge in BALB/c mice. (E) Allergen-specific IgE and total IgE levels 1 d after final airway challenge in BALB/c mice.
Figure 3.
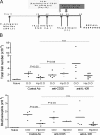
Anti-CD25 and anti–IL-10R antibody intervention in infected and allergic mice. (A) Protocol for treatment with anti-CD25 and anti–IL-10R antibodies. Naive or chronically infected mice were sensitized as previously described in “Significantly reduced airway inflammation…”; mice received 1 mg of isotype control, PC61 (anti-CD25), or 1B1.3a (anti–IL-10R) i.p. 1 d before airway challenge on day 56. Anti–IL-10R was also administered on day 58, 1 d before a final airway challenge on day 59. The experiment was terminated on day 60. (B) Total cell counts and eosinophil numbers in BALB/c mice treated with isotype control, and anti-CD25 or anti–IL-10R mAbs. In control Ab-treated animals, both total (P < 0.05) and eosinophil infiltration (P < 0.05) in _H. polygyrus_–infected mice were significantly reduced, using Student's t test. In PC61 treated mice, uninfected and infected groups were not statistically different.
Figure 4.
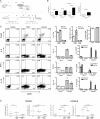
Transfer of protective effect with MLNC. (A) Protocol for transfer. All MLNC populations were harvested from donor mice 28 d after infection with H. polygyrus and transferred to recipients 7 d before airway challenge. (B) TGF-β expression in MLNC from naive and infected mice assayed by flow cytometry at day 14, 21, and 28 after infection with monoclonal anti–TGF-β1. Error bars show the mean ± SEM. (C) Expression of Foxp3 transcription factor and IL-4, IFN-γ, and IL-10 by CD25+ and CD25− MLNC from naive and 28-d-infected mice. For intracellular staining of Foxp3 and cytokines, representative individual FACS plots are shown against CD25 staining, together with a summary of percentage of positive cells taken from groups of five mice. The total number of CD25+ MLNC expressing Foxp3 in naive and infected mice is presented, together with the frequency of these cells within the whole CD4+ T cell population and the proportion of CD25+ cells that express Foxp3. Antigen-specific cytokine release was measured by ELISA from supernatants of 72-h cultured CD25-depleted or -enriched MLNC stimulated with medium or antigen extract from H. polygyrus adult parasites. (D) Total cell counts and eosinophil numbers in mice receiving 5 × 10⁷ MLNC from naive or infected donors. In the experiment with BALB/c mice, 100 μg of soluble adult parasite antigen was given 1 d after administration of either naive or infected donor cells. (E) Total cell counts and eosinophil numbers in mice receiving 4 × 10⁶ CD4+ or CD4− MLNC from infected donors. Cell fractions were 92.4% (CD4+) and 94.9% (CD4−) pure for BALB/c and 93.1% (CD4+) and 98.1% (CD4−) pure for C57BL/6. Group sizes were 8–10 for BALB/c and 15 for C57BL/6 mice. (F) Total IgE and allergen-specific IgE, measured in IgG-depleted serum, measured in BALB/c mice receiving 4 × 10⁶ CD4+ or CD4− MLNC from infected donors. Serum samples were collected from blood 1 d after final airway challenge. (E) Total cell counts and eosinophil numbers in mice receiving 4 × 10⁶ CD4+ or CD4− MLNC from infected donors. Cell fractions were 92.4% (CD4+) and 94.9% (CD4−) pure for BALB/c and 93.1% (CD4+) and 98.1% (CD4−) pure for C57BL/6. Group sizes were 8–10 for BALB/c and 15 for C57BL/6 mice. (F) Total IgE and allergen-specific IgE, measured in IgG- depleted serum, measured in BALB/c mice receiving 4 × 10⁶ CD4+ or CD4− MLNC from infected donors. Serum samples were collected from blood 1 d after final airway challenge.
Figure 5.
Suppression of allergy by MLNC transfer is intact in IL-10–deficient donors. Total cell counts and eosinophil numbers in Der p 1-sensitized WT C57BL/6 mice receiving 4 × 10⁶ CD4+ or CD4− MLNC from WT or IL-10–deficient infected donors. At day 7 and 9 after cell transfer, airway challenges were given, and BALF harvested 24 h after final challenge.
Figure 6.
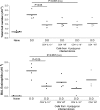
Transfer of protective effect with CD4**+CD25+** MLNC. (A) Total cell, eosinophil, and goblet cell numbers in mice receiving 3 × 10⁵ CD4+CD25+ or CD4+CD25− MLNC from infected donors. (B) Purity of CD4+CD25+ and CD4+CD25− populations assayed by flow cytometry. C57BL/6 MLNC fractions, which were 87.6% (CD4+CD25+) and 88.1% (CD4+CD25−) pure, are shown. Enriched cell fractions from BALB/c were 60.6% (CD4+CD25+) and 79.6% (CD4+CD25−) pure. (C) AB-PAS staining of formalin-fixed lung tissue, staining mucin- producing goblet cells, in BALB/c mice receiving 3 × 10⁵ CD4+CD25+ or CD4+CD25− MLNC from infected donors.
Figure 7.
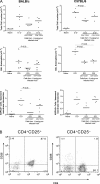
Tracking of donor lymphocytes in recipient mice. 4 × 10⁶ CD4+ or CD4− MLNC from infected mice were transferred i.v. into C57BL/6 (Ly5.2) recipients, 7 d before airway challenge. After the second airway challenge, lungs and thoracic lymph node (TLN) cells were recovered and stained for Ly5.1 and CD4 expression. Error bars show the mean ± SEM.
Similar articles
- Suppression of type 2 immunity and allergic airway inflammation by secreted products of the helminth Heligmosomoides polygyrus.
McSorley HJ, O'Gorman MT, Blair N, Sutherland TE, Filbey KJ, Maizels RM. McSorley HJ, et al. Eur J Immunol. 2012 Oct;42(10):2667-82. doi: 10.1002/eji.201142161. Epub 2012 Aug 8. Eur J Immunol. 2012. PMID: 22706967 Free PMC article. - Critical roles of regulatory B and T cells in helminth parasite-induced protection against allergic airway inflammation.
Gao X, Ren X, Wang Q, Yang Z, Li Y, Su Z, Li J. Gao X, et al. Clin Exp Immunol. 2019 Dec;198(3):390-402. doi: 10.1111/cei.13362. Epub 2019 Aug 26. Clin Exp Immunol. 2019. PMID: 31397879 Free PMC article. - Gastrointestinal nematode infection interferes with experimental allergic airway inflammation but not atopic dermatitis.
Hartmann S, Schnoeller C, Dahten A, Avagyan A, Rausch S, Lendner M, Bocian C, Pillai S, Loddenkemper C, Lucius R, Worm M, Hamelmann E. Hartmann S, et al. Clin Exp Allergy. 2009 Oct;39(10):1585-96. doi: 10.1111/j.1365-2222.2009.03290.x. Epub 2009 Jun 8. Clin Exp Allergy. 2009. PMID: 19508324 - Immune modulation and modulators in Heligmosomoides polygyrus infection.
Maizels RM, Hewitson JP, Murray J, Harcus YM, Dayer B, Filbey KJ, Grainger JR, McSorley HJ, Reynolds LA, Smith KA. Maizels RM, et al. Exp Parasitol. 2012 Sep;132(1):76-89. doi: 10.1016/j.exppara.2011.08.011. Epub 2011 Aug 22. Exp Parasitol. 2012. PMID: 21875581 Free PMC article. Review. - Regulatory T cells induced by parasites and the modulation of allergic responses.
Wilson MS, Maizels RM. Wilson MS, et al. Chem Immunol Allergy. 2006;90:176-195. doi: 10.1159/000088892. Chem Immunol Allergy. 2006. PMID: 16210910 Review.
Cited by
- Infection and treatment immunizations for successful parasite vaccines.
Mutapi F, Billingsley PF, Secor WE. Mutapi F, et al. Trends Parasitol. 2013 Mar;29(3):135-41. doi: 10.1016/j.pt.2013.01.003. Epub 2013 Feb 15. Trends Parasitol. 2013. PMID: 23415733 Free PMC article. - Regulatory T cells in infection.
Maizels RM, Smith KA. Maizels RM, et al. Adv Immunol. 2011;112:73-136. doi: 10.1016/B978-0-12-387827-4.00003-6. Adv Immunol. 2011. PMID: 22118407 Free PMC article. Review. - Regulatory T cells and parasites.
Velavan TP, Ojurongbe O. Velavan TP, et al. J Biomed Biotechnol. 2011;2011:520940. doi: 10.1155/2011/520940. Epub 2011 Dec 29. J Biomed Biotechnol. 2011. PMID: 22262943 Free PMC article. Review. - Immunity against helminths: interactions with the host and the intercurrent infections.
Moreau E, Chauvin A. Moreau E, et al. J Biomed Biotechnol. 2010;2010:428593. doi: 10.1155/2010/428593. Epub 2010 Feb 3. J Biomed Biotechnol. 2010. PMID: 20150967 Free PMC article. Review. - The changing microbial environment and chronic inflammatory disorders.
Rook GA. Rook GA. Allergy Asthma Clin Immunol. 2008 Sep 15;4(3):117-24. doi: 10.1186/1710-1492-4-3-117. Epub 2008 Sep 15. Allergy Asthma Clin Immunol. 2008. PMID: 20525133 Free PMC article.
References
- Sears, M.R. 1997. Epidemiology of childhood asthma. Lancet. 350:1015–1020. - PubMed
- Wills-Karp, M., J. Santeliz, and C.L. Karp. 2001. The germless theory of allergic disease: revisiting the hygiene hypothesis. Nat. Rev. Immunol. 1:69–75. - PubMed
- Umetsu, D.T., J.J. McIntire, O. Akbari, C. Macaubas, and R.H. DeKruyff. 2002. Asthma: an epidemic of dysregulated immunity. Nat. Immunol. 3:715–720. - PubMed
- Geha, R.S. 2003. Nature versus nurture in allergy and hypersensitivity. Curr. Opin. Immunol. 15:603–608. - PubMed
- Matricardi, P.M., F. Franzinelli, A. Franco, G. Caprio, F. Murru, D. Cioffi, L. Ferrigno, A. Palermo, N. Ciccarelli, and F. Rosmini. 1998. Sibship size, birth order, and atopy in 11,371 Italian young men. J. Allergy Clin. Immunol. 101:439–444. - PubMed
Publication types
MeSH terms
Substances
LinkOut - more resources
Full Text Sources
Other Literature Sources
Molecular Biology Databases
Research Materials
