Interaction of CagA with Crk plays an important role in Helicobacter pylori-induced loss of gastric epithelial cell adhesion - PubMed (original) (raw)
Interaction of CagA with Crk plays an important role in Helicobacter pylori-induced loss of gastric epithelial cell adhesion
Masato Suzuki et al. J Exp Med. 2005.
Abstract
CagA protein is a major virulence factor of Helicobacter pylori, which is delivered into gastric epithelial cells and elicits growth factor-like responses. Once within the cells, CagA is tyrosine phosphorylated by Src family kinases and targets host proteins required to induce the cell responses. We show that the phosphorylated CagA binds Crk adaptor proteins (Crk-II, Crk-I, and Crk-L) and that the interaction is important for the CagA-mediated host responses during H. pylori infection. H. pylori-induced scattering of gastric epithelial cells in culture was blocked by overexpression of dominant-negative Crk and by RNA interference-mediated knockdown of endogenous Crk. H. pylori infection of the gastric epithelium induced disruption of E-cadherin/catenin-containing adherens junctions, which was also dependent on CagA/Crk signaling. Furthermore, inhibition of the SoS1/H-Ras/Raf1, C3G/Rap1/B-Raf, or Dock180/Rac1/Wiskott-Aldrich syndrome protein family verprolin homologous protein pathway, all of which are involved downstream of Crk adaptors, greatly diminished the CagA-associated host responses. Thus, CagA targeting of Crk plays a central role in inducing the pleiotropic cell responses to H. pylori infection that cause several gastric diseases, including gastric cancer.
Figures
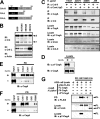
Figure 1.
CagA interacts with Crk adaptor proteins in a phosphorylation-dependent manner. (A) Schematic representations of Crk family adaptors. The numbers are the amino acid positions. (B) Lysates from various gastric epithelial cell lines were subjected to immunoblotting with the indicated antibodies. Note that the Crk antibody recognizes both Crk-II (top band) and Crk-I proteins (bottom band). (C) Lysates from AGS cells infected with various H. pylori strains were immunoprecipitated with anti–Crk-II antibody or normal rabbit IgG (control IgG), and the immunoprecipitates (IP) and lysates were subjected to immunoblotting with the indicated antibodies. Note that antiurease (H. pylori UreA) antibody was used as the bacterial control. (D–F) H. pylori_–infected AGS cell lysates prepared in the presence or absence of Na3VO4 were subjected to GST pull-down assay using the indicated GST fusion proteins, and the pulled-down proteins (PD) and lysates (input) were subjected to immunoblotting with the indicated antibodies. (G) Lysate from Δ_cagA H. pylori carrying the indicated pHel-FLAG vectors was coincubated for 30 min with AGS cell lysates (with Na3VO4) at 30°C. The lysates were subjected to GST pull-down assay with GST-SH2-Crk, and the PD and lysates were subjected to immunoblotting with the indicated antibodies.
Figure 2.
Crk signaling is critical for CagA activity. (A) AGS cells transiently transfected with Myc-tagged Crk-I (a), R38K-Crk (b), W170K-Crk (c), or R38K/W170K-Crk (d) expression plasmids were infected with H. pylori at an MOI of 100. The cells were fixed 5 h after infection and stained with anti-Myc tag antibody (green), phalloidin (red), and anti–H. pylori antibody (blue). Arrowheads point to long protruding structures of scattered cells. Bar, 20 μm. (B) Percentages of scattered cells in A. The black bar indicates the control. (C) Schematic representations of ExoT mutants. ADPRT-ExoT has a mutation in the GAP domain alone (R149K), whereas EEDD-ExoT has a mutation in both the GAP domain and the ADPRT domain (E383D and E385D). The numbers are the amino acid positions. (D) AGS cells transiently transfected with the indicated GFP plasmids were infected with H. pylori at an MOI of 100. The percentages of scattered GFP-positive cells were calculated 5 h after infection. At least 100 cells were counted in each experiment. The black bar indicates the control. The data shown represent means and SDs of triplicate experiments.
Figure 3.
_H. pylori_–induced cell scattering/hummingbird phenotype is blocked by Crk-RNAi. (A) Lysates from AGS cells transfected for 72 h with the siRNAs as indicated were subjected to immunoblotting with the indicated antibodies. (B) AGS cells in A were infected with H. pylori at an MOI of 100, and the percentages of scattered cells were calculated 5 h after infection. The black bar indicates the control. The data shown represent means and SDs of triplicate experiments with at least 100 cells each. (C) Comparison between the nucleotide sequences of crk coding sequences (cds) and crk R cds. To generate crk R, two adenine nucleotides were replaced by thymine nucleotides (red letters) in the Crk-siRNA–targeted sequence of the crk gene. (D) Lysates from AGS cells transfected with Luc-siRNA or Crk-siRNA at 200 nM for 72 h and with GFP or GFP-CrkR plasmid for 20 h were subjected to immunoblotting with the indicated antibodies. (E) AGS cells transfected with the indicated siRNAs for 72 h and with the indicated GFP plasmids for 20 h were infected with H. pylori at an MOI of 100. The percentages of scattered GFP-positive cells were counted 5 h after infection. The black bar indicates the control. The data shown represent means and SDs of triplicate experiments with at least 100 cells each. (F) AGS cells transfected with Luc-siRNA at 400 nM for 72 h (a–d) or Crk/Crk-L-siRNA at 400 nM for 72 h (e–h) and with GFP-CrkR plasmid for 20 h (a–h) were infected with H. pylori at an MOI of 100. Phase-contrast images of each type of infected cell were monitored by time-lapse microscopy 90 (a and e), 180 (b and f), 270 (c and g), and 360 (d and h) min after infection (the entire sequence is shown in Videos S1 and S2). Green numbers point to the same GFP-CrkR–expressing cells, and red asterisks point to the same RNAi-treated cells. Bar, 20 μm. (G, a and b) GFP fluorescence of GFP-CrkR in F (a and e) were observed, respectively.
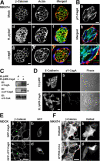
Figure 4.
CagA disrupts epithelial AJs. (A) MKN74 cells were mock infected (a–c) and infected with H. pylori WT (d–f) or the Δ_cagA_ strain (g–i) at an MOI of 20. The cells were fixed 48 h after infection and stained with anti–β-catenin antibody (a, c, d, f, g, and i), phalloidin (b, c, e, f, h, and i), and anti–H. pylori antibody (c, f, and i). Bar, 20 μm. (B) H. pylori_–infected MKN74 cells in the same condition as A were stained with anti–pY-CagA antibody (a–c), anti–_H. pylori antibody (b and c), and phalloidin (b and c). Bar, 20 μm. (C) EL cells stably expressing CagA (EL/pMX-CagA) were generated by pMX retrovirus infection (see Materials and methods), and the lysates from EL/pMX (control) and EL/pMX-CagA cells were subjected to immunoblotting with the indicated antibodies. Arrowheads indicate the CagA blot and the pY-CagA blot, respectively. (D) EL/pMX (a–c) or EL/pMX-CagA (d–f) cells were stained with anti–E-cadherin antibody (a and d) and anti–pY-CagA antibody (b and e). Phase-contrast images are also shown (c and f). Bar, 20 μm. (E) MDCK cells transiently transfected with GFP-CagA (a and b) or GFP-ΔPY-CagA plasmids (c and d) were fixed 48 h later and stained with anti–β-catenin antibody (a and c) and observed together for GFP fluorescence (b and d). Green arrowheads point to GFP-positive cells. Bar, 20 μm. (F) DsRed2 (a and b) or DsRed2-W170K-Crk-I plasmids (c and d) were microinjected into the nuclei of MKN74 cells. After incubation for 5–8 h, cells were infected with H. pylori at an MOI of 20 and fixed 48 h later. The infected cells were stained with anti–β-catenin antibody (a and c) and observed together for DsRed fluorescence (b and d). Red arrowheads point to DsRed-positive cells. Bar, 20 μm.
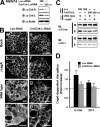
Figure 5.
Crk stimulates CagA-dependent breakdown of cell–cell adhesion. (A) Lysates from MKN74 cells transfected for 72 h with Luc-siRNA or Crk-siRNA at 200 nM were subjected to immunoblotting with the indicated antibodies. (B) MKN74 cells treated for 72 h with Luc-RNAi (a–d) or Crk/Crk-L-RNAi (e–h) were mock infected (a and e) or infected with the H. pylori Δ_vacA_/Δ_cagA_ (b and f) or Δ_vacA_ strain (c, d, g, and h) at an MOI of 20. The cells were fixed 48 h after infection and stained with anti–β-catenin antibody. White arrowheads (d and h) point to the nuclei of the cells. Note that Δ_vacA H. pylori_ strains were used to reduce damage to the infected cells (references 1, 60). Bar, 20 μm. (C) NP-40–soluble (S) and –insoluble fractions (IS) were prepared from H. pylori_–infected cells in B, and the fractions were subjected to immunoblotting with the indicated antibodies. (D) The blots of NP-40–soluble fractions in C were quantified by densitometry. The data are presented as fold increase in amounts of Δ_vacA compared with that of Δ_vacA_/Δ_cagA_ under the same RNAi conditions. The data shown represent means and SDs of triplicate experiments.
Figure 6.
Either Gab1, EGFR, or c-Met is dispensable for CagA/Crk signaling. (A and B) AGS cells transiently transfected with the indicated plasmids were infected with H. pylori at an MOI of 100. The percentages of scattered cells were calculated 5 h after infection. (C) AGS cells were transfected for 72 h with the siRNAs as indicated. The Gab1 knockdown cells were examined by immunoblotting with anti-Gab1 antibody (top right). The arrowhead indicates the Gab1 blot. RNAi-treated cells were also infected with H. pylori at an MOI of 100. The percentages of scattered cells were calculated 5 h after infection. The black bars in A–C indicate the controls. The data shown in A–C represent means and SDs of triplicate experiments (at least 100 cells were counted in each experiment). (D) The lysates from AGS and T47D cells were subjected to immunoblotting with the indicated antibodies. (E) T47D cells were serum starved for 24 h and stimulated with H. pylori for 8 h (MOI = 100), or growth factors were dissolved in DMSO for 30 min as indicated. The cells were also pretreated with or without AG1478 30 min before stimulation. The lysates were prepare after stimulation and subjected to immunoblotting with the indicated antibodies. (F) T47D cells were pretreated for 30 min with AG1478 at 1 μM and infected with WT H. pylori (a) or the Δ_virD4_ strain (b) at an MOI of 100. Phase-contrast microscopy was performed 24 h after infection. Bar, 20 μm.
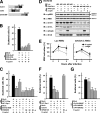
Figure 7.
CagA/Crk signaling up-regulates cell proliferation and reorganization of the actin cytoskeleton. (A) Schematic representations of Crk binding GEFs. Each PRR region contains the indicated number of proline-rich (PxxP) motifs. The numbers are the amino acid positions. (B, C, F, and G) AGS cells transiently transfected with the indicated expression plasmids were infected with H. pylori at an MOI of 100. The cells in C and F were also treated with the indicated inhibitors 30 min before infection. The percentages of scattered cells were calculated 5 h after infection. At least 100 cells were counted in each experiment. The black bars indicate the controls. The data shown indicate means and SDs of triplicate experiments. (D) KATOIII cells transfecting siRNA at 400 nM for 120 h were serum starved for 2 h and infected with H. pylori at an MOI of 100 as indicated. The lysates were prepared at the indicated time points after infection and subjected to immunoblotting with the indicated antibodies. (E) The blots of phosphorylated MEK in D were quantified by densitometry. The data are presented as fold activation over the uninfected control under the same RNAi conditions. The data shown indicate means and SDs of triplicate experiments.
Figure 8.
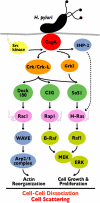
H. pylori CagA cracks the host signaling via its interaction with Crk. CagA translocated from H. pylori into the host cell is tyrosine phosphorylated by SFKs and interacts with Crk/Crk-L adaptors. Crk is involved in MAPK activation leading to cell growth and proliferation through the Crk/SoS1/H-Ras/Raf1 and Crk/C3G/Rap1/B-Raf pathways. Crk also promotes Rac1 activity through the Crk/Dock180/ELMO pathway. Activated Rac1 induces actin reorganization by stimulating downstream effectors such as WAVE family proteins. These motogenic, mitogenic, and morphologic effects downstream of CagA/Crk signaling are required for _H. pylori_–induced cell scattering/hummingbird phenotype and cell–cell dissociation.
Similar articles
- Interaction between the Helicobacter pylori CagA and alpha-Pix in gastric epithelial AGS cells.
Baek HY, Lim JW, Kim H. Baek HY, et al. Ann N Y Acad Sci. 2007 Jan;1096:18-23. doi: 10.1196/annals.1397.065. Ann N Y Acad Sci. 2007. PMID: 17405911 - Helicobacter pylori CagA protein targets the c-Met receptor and enhances the motogenic response.
Churin Y, Al-Ghoul L, Kepp O, Meyer TF, Birchmeier W, Naumann M. Churin Y, et al. J Cell Biol. 2003 Apr 28;161(2):249-55. doi: 10.1083/jcb.200208039. J Cell Biol. 2003. PMID: 12719469 Free PMC article. - Helicobacter pylori CagA interacts with E-cadherin and deregulates the beta-catenin signal that promotes intestinal transdifferentiation in gastric epithelial cells.
Murata-Kamiya N, Kurashima Y, Teishikata Y, Yamahashi Y, Saito Y, Higashi H, Aburatani H, Akiyama T, Peek RM Jr, Azuma T, Hatakeyama M. Murata-Kamiya N, et al. Oncogene. 2007 Jul 12;26(32):4617-26. doi: 10.1038/sj.onc.1210251. Epub 2007 Jan 22. Oncogene. 2007. PMID: 17237808 - Helicobacter pylori and gastric cancer: what can be learned by studying the response of gastric epithelial cells to the infection?
Mueller A, Falkow S, Amieva MR. Mueller A, et al. Cancer Epidemiol Biomarkers Prev. 2005 Aug;14(8):1859-64. doi: 10.1158/1055-9965.EPI-04-0820. Cancer Epidemiol Biomarkers Prev. 2005. PMID: 16103426 Review. - The role of CagA status in gastric and extragastric complications of Helicobacter pylori.
Perez-Perez GI, Peek RM, Legath AJ, Heine PR, Graff LB. Perez-Perez GI, et al. J Physiol Pharmacol. 1999 Dec;50(5):833-45. J Physiol Pharmacol. 1999. PMID: 10695563 Review.
Cited by
- Helicobacter pylori in gastric carcinogenesis: mechanisms.
Wroblewski LE, Peek RM Jr. Wroblewski LE, et al. Gastroenterol Clin North Am. 2013 Jun;42(2):285-98. doi: 10.1016/j.gtc.2013.01.006. Epub 2013 Mar 6. Gastroenterol Clin North Am. 2013. PMID: 23639641 Free PMC article. Review. - Impact of the Helicobacter pylori Oncoprotein CagA in Gastric Carcinogenesis.
Hatakeyama M. Hatakeyama M. Curr Top Microbiol Immunol. 2023;444:239-257. doi: 10.1007/978-3-031-47331-9_9. Curr Top Microbiol Immunol. 2023. PMID: 38231221 - Tyrosine Kinases in Helicobacter pylori Infections and Gastric Cancer.
Chichirau BE, Diechler S, Posselt G, Wessler S. Chichirau BE, et al. Toxins (Basel). 2019 Oct 11;11(10):591. doi: 10.3390/toxins11100591. Toxins (Basel). 2019. PMID: 31614680 Free PMC article. Review. - Helicobacter pylori CagA: From Pathogenic Mechanisms to Its Use as an Anti-Cancer Vaccine.
Stein M, Ruggiero P, Rappuoli R, Bagnoli F. Stein M, et al. Front Immunol. 2013 Oct 15;4:328. doi: 10.3389/fimmu.2013.00328. Front Immunol. 2013. PMID: 24133496 Free PMC article. Review. - Changes of tight junction and interleukin-8 expression using a human gastroid monolayer model of Helicobacter pylori infection.
Uotani T, Murakami K, Uchida T, Tanaka S, Nagashima H, Zeng XL, Akada J, Estes MK, Graham DY, Yamaoka Y. Uotani T, et al. Helicobacter. 2019 Jun;24(3):e12583. doi: 10.1111/hel.12583. Epub 2019 Apr 5. Helicobacter. 2019. PMID: 30950121 Free PMC article.
References
- Rieder, G., W. Fischer, and R. Haas. 2005. Interaction of Helicobacter pylori with host cells: function of secreted and translocated molecules. Curr. Opin. Microbiol. 8:67–73. - PubMed
- Suerbaum, S., and P. Michetti. 2002. Helicobacter pylori infection. N. Engl. J. Med. 347:1175–1186. - PubMed
- Montecucco, C., and R. Rappuoli. 2001. Living dangerously: how Helicobacter pylori survives in the human stomach. Nat. Rev. Mol. Cell Biol. 2:457–466. - PubMed
- Odenbreit, S., J. Puls, B. Sedlmaier, E. Gerland, W. Fischer, and R. Haas. 2000. Translocation of Helicobacter pylori CagA into gastric epithelial cells by type IV secretion. Science. 287:1497–1500. - PubMed
Publication types
MeSH terms
Substances
LinkOut - more resources
Full Text Sources
Other Literature Sources
Medical
Molecular Biology Databases
Research Materials
Miscellaneous
