Elucidation of clathrin-mediated endocytosis in tetrahymena reveals an evolutionarily convergent recruitment of dynamin - PubMed (original) (raw)
Elucidation of clathrin-mediated endocytosis in tetrahymena reveals an evolutionarily convergent recruitment of dynamin
Nels C Elde et al. PLoS Genet. 2005 Nov.
Abstract
Ciliates, although single-celled organisms, contain numerous subcellular structures and pathways usually associated with metazoans. How this cell biological complexity relates to the evolution of molecular elements is unclear, because features in these cells have been defined mainly at the morphological level. Among these ciliate features are structures resembling clathrin-coated, endocytic pits associated with plasma membrane invaginations called parasomal sacs. The combination of genome-wide sequencing in Tetrahymena thermophila with tools for gene expression and replacement has allowed us to examine this pathway in detail. Here we demonstrate that parasomal sacs are sites of clathrin-dependent endocytosis and that AP-2 localizes to these sites. Unexpectedly, endocytosis in Tetrahymena also involves a protein in the dynamin family, Drp1p (Dynamin-related protein 1). While phylogenetic analysis of AP subunits indicates a primitive origin for clathrin-mediated endocytosis, similar analysis of dynamin-related proteins suggests, strikingly, that the recruitment of dynamin-family proteins to the endocytic pathway occurred independently during the course of the ciliate and metazoan radiations. Consistent with this, our functional analysis suggests that the precise roles of dynamins in endocytosis, as well as the mechanisms of targeting, differ in metazoans and ciliates.
Conflict of interest statement
Competing interests. The authors have declared that no competing interests exist.
Figures
Figure 1. Overview of Endocytosis
(A) Schematic diagram of clathrin-coated vesicle formation in metazoans. AP-2 (red) serves as an adapter. It can interact with receptors destined for internalization while also recruiting clathrin (green) to the plasma membrane. Clathrin assembly at those sites drives or facilitates membrane invagination. Dynamin (blue) assembles at the neck of a nascent vesicle to promote membrane fission. (B) Domains of classical dynamin and of DRPs.
Figure 2. Visualizing Sites of Endocytosis
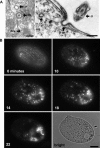
(A) In Tetrahymena, coated pits (cp) are found near the base of cilia, as shown in tangential (left) and cross (right) sections. bb, ciliary basal body; ci, cilia; cv, coated vesicle; mt, mitochondrion; dcv, dense core vesicle. Bars = 200 nm. (B) Time course of FM1–43 dye uptake. A cell shown immediately after treatment with 5 μM FM1–43 (0 min) shows rows of fluorescent puncta at the cell surface. Time-lapse images (10, 14, 18, and 22 min) of a single cell following 5-min exposure to FM1–43. At the later time points (18 and 22 min), the dye accumulates in what appear as vesicles clustered toward the cell posterior. The brightfield image shows the cell at the end of the time course. Bar = 10 μm.
Figure 3. Analysis of CHC
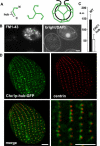
(A) Cartoon of CHC assembly. The location of the C-terminal hub domain is indicated. (B) Expression of truncated CHC (hub) inhibits endocytosis. Wild-type (DAPI-labeled) and CHC hub-expressing cells were mixed and incubated with FM1–43. Reduced FM1–43 uptake is detected in the hub-expressing cell. (C) Quantification of FM1–43 uptake. FM1–43 uptake was quantified by analysis of 20 image pairs such as those shown in (B), as described in Materials and Methods. The fluorescence units are arbitrary (a.u.). WT, wild-type. (D) Cells expressing Chc1p-hub-GFP (from the MTT1 promoter) were fixed, permeabilized, and labeled with anti-centrin antibody. The merged image shows the close proximity of clathrin hub-GFP to basal bodies, comparable to Figure 2. Bar = 5 μm (B and D).
Figure 4. Phylogenetic Analysis and Localization of the AP-2 μ Subunit
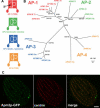
(A) Schematic representation and cellular localization of the heterotetrameric AP complexes. Location of the μ subunit is indicated. TGN, trans-Golgi network. (B) AP complex μ subunit phylogeny. The topology illustrated is the best maximum likelihood (ML) distance for μ subunits from A. thaliana (At), D. melanogaster (Dm), H. sapiens (Hs), and T. thermophila (Tt). Both ML and maximum parsimony (MP) bootstrap support values are shown at each node. (C) Fixed, permeabilized cells expressing GFP-tagged AP-2 μ subunit (Apm2p-GFP) (from the MTT1 promoter) were labeled with anti-centrin antibody. The distribution of Apm2p-GFP is similar to that of the CHC hub (Figure 3), but the former is additionally present at the contractile vacuole pores. Bar = 5 μm.
Figure 5. Localization of Drp1p
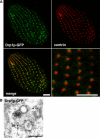
(A) Fixed, permeabilized cells expressing Drp1p-GFP (from the MTT1 promoter) were labeled with anti-centrin antibody. Like CHC and AP-2 μ subunit, Drp1p-GFP localizes to sites near basal bodies. Bars = 5 μm. (B) Immuno-gold visualization of Drp1p-GFP shows localization to a coated pit (cp) near a basal body (bb). Bar = 200 nm.
Figure 6. Functional Analysis of DRP1
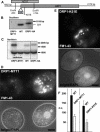
(A) The DRP1 locus, with strategy for NEO3 disruption and HA epitope tagging, both via homologous recombination. (B) Southern blot of wild-type (WT) and drp1–1::neo3 lines rescued with DRP1 integrated at the MTT1 locus (DRP1-MTT1) or DRP1 tagged with HA (DRP1-HA). (C) Northern blots of wild-type (WT) and rescued (DRP1-MTT1) lines. Analysis of DRP1-MTT1 maintained with (+) or without (−) cadmium for 16 h demonstrates that transcript expression is cadmium-dependent. The expression of DRP1-HA, at the endogenous locus, is comparable to wild-type. The band near 1 kb serves as a loading control. (D) FM1–43 uptake depends on Drp1p. _DRP1-MTT1_cells were maintained in cadmium-free medium for 16 h and mixed with wild-type (DAPI labeled) as described in text. (E) Impaired uptake of FM1–43 in cells expressing, from the MTT1 promoter, the K51E allele of DRP1. (F) Quantitative comparison of FM1–43 uptake, shown in arbitrary fluorescence units (a.u.). Bar = 10 μm (D and E).
Figure 7. Dual Localization of Drp1p-HA and Apm2p-GFP
Cells expressing Drp1p-HA at the wild-type locus were transformed to express Apm2p-GFP driven by the MTT1 promoter. Fixed, permeabilized cells were immunolabeled with anti-HA antibody. The merged image (bottom) indicates that the two proteins are present in adjacent, partially overlapping puncta. Bar = 5 μm.
Figure 8. Phylogenetic Analysis of Dynamin and DRPs
Best maximum likelihood topology for dynamin and DRPs. Maximum likelihood (ML) and maximum parsimony (MP) bootstrap values over 50% are indicated. Ciliate DRPs (Tetrahymena and Paramecium) are in italics, DRPs with mitochondrial function are green, nuclear DRPs are in blue, and endocytic dynamins are red. A. nidulans, Aspergillus nidulans; G. intestinalis, Giardia intestinalis; G. maxx, Glycine max; P. falciparum, Plasmodium falciparum; P. yoelii, Plasmodium yoelii.
Figure 9. Comparison of the Actin-Dependence of Endocytosis versus Phagocytosis
(A) Cells treated with cytB (25 μM, 30 min) were mixed with untreated cells and incubated with FM1–43 (5 min, no cytB). Prior to mixing, cells not treated with cytB were incubated for 10 min with DAPI, to label the nuclei. All cells showed equivalent FM1–43 uptake. (B) Quantitative comparison of FM1–43 uptake, in arbitrary fluorescence units (a.u.). The first set of bars represents pairs (n = 4) of cells as described in (A). The second set of bars represents pairs (n = 20) of cells in which cytB was also included during the 5-min incubation with FM1–43, to rule out potential reversal of inhibition during drug washout. Exposure to cytB for 5 min did not itself inhibit FM1–43 uptake. This is shown in the third set of bars, representing pairs (n = 20) of cells incubated for 5 min in FM1–43 or FM1–43 plus cytB. (C) Under the same conditions as (A), cytB treatment inhibited india ink uptake via phagocytosis from the oral apparatus. Treated cells show a single ink-containing vacuole (arrow), while untreated cells (DAPI labeled) always contain several. Bars = 10 μm.
Figure 10. Analysis of Drp1p Targeting by Chimera Analysis
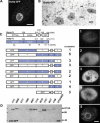
(A) Compiled stack of confocal sections through fixed cell expressing Drp6p-GFP (driven by the MTT1 promoter) shows localization at the nuclear envelope. Bar = 10 μm. (B) Immuno-gold visualization of Drp6p-GFP shows localization in clusters on the cytoplasmic face of the nuclear envelope (ne). Regions of heterochromatin within the macronucleus (mac) are indicated (*). Bar = 200 nm. (C) Domain comparison of Drp1p and Drp6p and diagrams of Drp-GFP chimeras (expressed under the MTT1 promoter) indicating localization. Numbered images at right show localization patterns observed in cells expressing chimeric proteins. Bar = 10 μm. nd, not detected. (D) Western blot of total cell lysates from Drp-GFP cells confirms stability of full-length chimeras.
Similar articles
- Dynamin- and clathrin-dependent endocytic pathway in unicellular eukaryote Paramecium.
Wiejak J, Surmacz L, Wyroba E. Wiejak J, et al. Biochem Cell Biol. 2004 Oct;82(5):547-58. doi: 10.1139/o04-098. Biochem Cell Biol. 2004. PMID: 15499383 - Aquaporin-2 localization in clathrin-coated pits: inhibition of endocytosis by dominant-negative dynamin.
Sun TX, Van Hoek A, Huang Y, Bouley R, McLaughlin M, Brown D. Sun TX, et al. Am J Physiol Renal Physiol. 2002 Jun;282(6):F998-1011. doi: 10.1152/ajprenal.00257.2001. Am J Physiol Renal Physiol. 2002. PMID: 11997316 - [Recent advances in the study of synaptic endocytosis key protein: Dynamin].
Cai T, Yuan W. Cai T, et al. Zhong Nan Da Xue Xue Bao Yi Xue Ban. 2014 Oct;39(10):1088-92. doi: 10.11817/j.issn.1672-7347.2014.10.018. Zhong Nan Da Xue Xue Bao Yi Xue Ban. 2014. PMID: 25355262 Review. Chinese. - The long life of an endocytic patch that misses AP-2.
de León N, Valdivieso MH. de León N, et al. Curr Genet. 2016 Nov;62(4):765-770. doi: 10.1007/s00294-016-0605-3. Epub 2016 Apr 28. Curr Genet. 2016. PMID: 27126383 Review.
Cited by
- The zinc finger protein Zfr1p is localized specifically to conjugation junction and required for sexual development in Tetrahymena thermophila.
Xu J, Tian H, Wang W, Liang A. Xu J, et al. PLoS One. 2012;7(12):e52799. doi: 10.1371/journal.pone.0052799. Epub 2012 Dec 10. PLoS One. 2012. PMID: 23251712 Free PMC article. - Endocytosis and signaling: cell logistics shape the eukaryotic cell plan.
Sigismund S, Confalonieri S, Ciliberto A, Polo S, Scita G, Di Fiore PP. Sigismund S, et al. Physiol Rev. 2012 Jan;92(1):273-366. doi: 10.1152/physrev.00005.2011. Physiol Rev. 2012. PMID: 22298658 Free PMC article. Review. - The Tetrahymena bcd1 mutant implicates endosome trafficking in ciliate, cortical pattern formation.
Cole ES, Maier W, Joachimiak E, Jiang YY, Lee C, Collet E, Chmelik C, Romero DP, Chalker D, Alli NK, Ruedlin TM, Ozzello C, Gaertig J. Cole ES, et al. Mol Biol Cell. 2023 Jul 1;34(8):ar82. doi: 10.1091/mbc.E22-11-0501. Epub 2023 May 10. Mol Biol Cell. 2023. PMID: 37163326 Free PMC article. - Cardiolipin targets a dynamin-related protein to the nuclear membrane.
Kar UP, Dey H, Rahaman A. Kar UP, et al. Elife. 2021 Mar 4;10:e64416. doi: 10.7554/eLife.64416. Elife. 2021. PMID: 33661098 Free PMC article.
References
- Conner SD, Schmid SL. Regulated portals of entry into the cell. Nature. 2003;422:37–44. - PubMed
- Brodsky FM, Chen CY, Knuehl C, Towler MC, Wakeham DE. Biological basket weaving: Formation and function of clathrin-coated vesicles. Annu Rev Cell Dev Biol. 2001;17:517–568. - PubMed
- Kirchhausen T. Adaptors for clathrin-mediated traffic. Annu Rev Cell Dev Biol. 1999;15:705–732. - PubMed
- Marks B, Stowell MH, Vallis Y, Mills IG, Gibson A, et al. GTPase activity of dynamin and resulting conformation change are essential for endocytosis. Nature. 2001;410:231–235. - PubMed
- Chen YJ, Zhang P, Egelman EH, Hinshaw JE. The stalk region of dynamin drives the constriction of dynamin tubes. Nat Struct Mol Biol. 2004;11:574–575. - PubMed
Publication types
MeSH terms
Substances
Grants and funding
- GM-592688/GM/NIGMS NIH HHS/United States
- R21 GM067898/GM/NIGMS NIH HHS/United States
- R01 GM077607/GM/NIGMS NIH HHS/United States
- T32 GM007197/GM/NIGMS NIH HHS/United States
- GM-067898/GM/NIGMS NIH HHS/United States
- GM-07197/GM/NIGMS NIH HHS/United States
LinkOut - more resources
Full Text Sources
Research Materials

