Reduced mitochondrial density and increased IRS-1 serine phosphorylation in muscle of insulin-resistant offspring of type 2 diabetic parents - PubMed (original) (raw)
. 2005 Dec;115(12):3587-93.
doi: 10.1172/JCI25151. Epub 2005 Nov 10.
Kitt Falk Petersen, Sylvie Dufour, Douglas Befroy, Jared Frattini, Nadine Shatzkes, Susanne Neschen, Morris F White, Stefan Bilz, Saki Sono, Marc Pypaert, Gerald I Shulman
Affiliations
- PMID: 16284649
- PMCID: PMC1280967
- DOI: 10.1172/JCI25151
Reduced mitochondrial density and increased IRS-1 serine phosphorylation in muscle of insulin-resistant offspring of type 2 diabetic parents
Katsutaro Morino et al. J Clin Invest. 2005 Dec.
Abstract
To further explore the nature of the mitochondrial dysfunction and insulin resistance that occur in the muscle of young, lean, normoglycemic, insulin-resistant offspring of parents with type 2 diabetes (IR offspring), we measured mitochondrial content by electron microscopy and insulin signaling in muscle biopsy samples obtained from these individuals before and during a hyperinsulinemic-euglycemic clamp. The rate of insulin-stimulated muscle glucose uptake was approximately 60% lower in the IR offspring than the control subjects and was associated with an approximately 60% increase in the intramyocellular lipid content as assessed by H magnetic resonance spectroscopy. Muscle mitochondrial density was 38% lower in the IR offspring. These changes were associated with a 50% increase in IRS-1 Ser312 and IRS-1 Ser636 phosphorylation and an approximately 60% reduction in insulin-stimulated Akt activation in the IR offspring. These data provide new insights into the earliest defects that may be responsible for the development of type 2 diabetes and support the hypothesis that reductions in mitochondrial content result in decreased mitochondrial function, which predisposes IR offspring to intramyocellular lipid accumulation, which in turn activates a serine kinase cascade that leads to defects in insulin signaling and action in muscle.
Figures
Figure 1
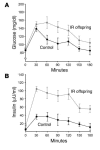
Results of oral glucose tolerance test. Mean plasma concentrations of glucose (A) and insulin (B) before and during a 75-g oral glucose tolerance test in control subjects (n = 6) and IR offspring (n = 8). P = 0.0009 for the comparison of the areas under the curve for insulin concentration of control subjects and IR offspring.
Figure 2
Hyperinsulinemic-euglycemic clamp and intramyocellular lipid content. (A) Insulin-stimulated rates of muscle glucose metabolism in control subjects (n = 6) and IR offspring (n = 8). (B) Intramyocellular lipid content in soleus muscle of control subjects (n = 6) and IR offspring (n = 8), measured by localized 1H MRS.
Figure 3
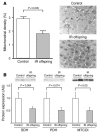
Mitochondrial density and gene expression data. (A) Mitochondrial density in control subjects (n = 6) and IR offspring (n = 8), assessed by electron microscopy. The pound symbol (#) indicates muscle fiber; the asterisk indicates mitochondrion. (B) Mitochondrial protein expressions assessed by Western blotting in control subjects (n = 6) and IR offspring (n = 9). Results were normalized to β-actin protein expression. SDH, succinate dehydrogenase; PDH, pyruvate dehydrogenase.
Figure 4
mRNA and protein expression of mitochondrial biogenesis genes. (A) mRNA expression of PGC-1 and downstream genes determined by real-time quantitative PCR using a TaqMan probe in control subjects (n = 7) and IR offspring (n = 13). (B) Protein expression of PGC-1α, PGC-1β, and mtTFA measured by Western blotting in control subjects (n = 6) and IR offspring (n = 9). (C) mtDNA copy number was determined by real-time quantitative PCR using a TaqMan probe against NADH dehydrogenase 2 (ND2) and β-actin. mtDNA copy number was calculated as the ratio of ND2 to β-actin in control subjects (n = 7) and IR offspring (n = 9).
Figure 5
Insulin signaling data. (A) IRS-1 serine phosphorylation at Ser307, Ser312, Ser616, and Ser636 in the basal state in control subjects (n = 10) and IR offspring (n = 7). (B) Insulin-stimulated Akt phosphorylation at 20 minutes on Ser473 in control subjects (n = 5) and IR offspring (n = 7). Akt phosphorylation was normalized to total Akt protein expression.
Similar articles
- Decreased insulin-stimulated ATP synthesis and phosphate transport in muscle of insulin-resistant offspring of type 2 diabetic parents.
Petersen KF, Dufour S, Shulman GI. Petersen KF, et al. PLoS Med. 2005 Sep;2(9):e233. doi: 10.1371/journal.pmed.0020233. Epub 2005 Aug 16. PLoS Med. 2005. PMID: 16089501 Free PMC article. Clinical Trial. - Insulin signal transduction in skeletal muscle from glucose-intolerant relatives of type 2 diabetic patients [corrected].
Storgaard H, Song XM, Jensen CB, Madsbad S, Björnholm M, Vaag A, Zierath JR. Storgaard H, et al. Diabetes. 2001 Dec;50(12):2770-8. doi: 10.2337/diabetes.50.12.2770. Diabetes. 2001. PMID: 11723060 - Dissociation between fat-induced in vivo insulin resistance and proximal insulin signaling in skeletal muscle in men at risk for type 2 diabetes.
Storgaard H, Jensen CB, Björnholm M, Song XM, Madsbad S, Zierath JR, Vaag AA. Storgaard H, et al. J Clin Endocrinol Metab. 2004 Mar;89(3):1301-11. doi: 10.1210/jc.2003-031243. J Clin Endocrinol Metab. 2004. PMID: 15001626 Clinical Trial. - Molecular mechanisms of insulin resistance in humans and their potential links with mitochondrial dysfunction.
Morino K, Petersen KF, Shulman GI. Morino K, et al. Diabetes. 2006 Dec;55 Suppl 2(Suppl 2):S9-S15. doi: 10.2337/db06-S002. Diabetes. 2006. PMID: 17130651 Free PMC article. Review. - IRS-1 regulation in health and disease.
Schmitz-Peiffer C, Whitehead JP. Schmitz-Peiffer C, et al. IUBMB Life. 2003 Jul;55(7):367-74. doi: 10.1080/1521654031000138569. IUBMB Life. 2003. PMID: 14584587 Review.
Cited by
- Association of blood lactate with carotid atherosclerosis: the Atherosclerosis Risk in Communities (ARIC) Carotid MRI Study.
Shantha GP, Wasserman B, Astor BC, Coresh J, Brancati F, Sharrett AR, Young JH. Shantha GP, et al. Atherosclerosis. 2013 May;228(1):249-55. doi: 10.1016/j.atherosclerosis.2013.02.014. Epub 2013 Feb 28. Atherosclerosis. 2013. PMID: 23510829 Free PMC article. - Novel role for thioredoxin reductase-2 in mitochondrial redox adaptations to obesogenic diet and exercise in heart and skeletal muscle.
Fisher-Wellman KH, Mattox TA, Thayne K, Katunga LA, La Favor JD, Neufer PD, Hickner RC, Wingard CJ, Anderson EJ. Fisher-Wellman KH, et al. J Physiol. 2013 Jul 15;591(14):3471-86. doi: 10.1113/jphysiol.2013.254193. Epub 2013 Apr 22. J Physiol. 2013. PMID: 23613536 Free PMC article. - Mitochondrial complex I and V gene polymorphisms in type II diabetes mellitus among high risk Mizo-Mongoloid population, Northeast India.
Lalrohlui F, Thapa S, Ghatak S, Zohmingthanga J, Senthil Kumar N. Lalrohlui F, et al. Genes Environ. 2016 Mar 1;38:5. doi: 10.1186/s41021-016-0034-z. eCollection 2016. Genes Environ. 2016. PMID: 27350825 Free PMC article. - Peripheral insulin resistance in obese girls with hyperandrogenism is related to oxidative phosphorylation and elevated serum free fatty acids.
Cree-Green M, Newcomer BR, Coe G, Newnes L, Baumgartner A, Brown MS, Pyle L, Reusch JE, Nadeau KJ. Cree-Green M, et al. Am J Physiol Endocrinol Metab. 2015 May 1;308(9):E726-33. doi: 10.1152/ajpendo.00619.2014. Epub 2015 Feb 24. Am J Physiol Endocrinol Metab. 2015. PMID: 25714677 Free PMC article. - Impaired in vivo mitochondrial function but similar intramyocellular lipid content in patients with type 2 diabetes mellitus and BMI-matched control subjects.
Schrauwen-Hinderling VB, Kooi ME, Hesselink MK, Jeneson JA, Backes WH, van Echteld CJ, van Engelshoven JM, Mensink M, Schrauwen P. Schrauwen-Hinderling VB, et al. Diabetologia. 2007 Jan;50(1):113-20. doi: 10.1007/s00125-006-0475-1. Epub 2006 Nov 9. Diabetologia. 2007. PMID: 17093944
References
- Griffin ME, et al. Free fatty acid-induced insulin resistance is associated with activation of protein kinase C theta and alterations in the insulin signaling cascade. Diabetes. 1999;48:1270–1274. - PubMed
- Yu C, et al. Mechanism by which fatty acids inhibit insulin activation of insulin receptor substrate-1 (IRS-1)-associated phosphatidylinositol 3-kinase activity in muscle. J. Biol. Chem. 2002;277:50230–50236. - PubMed
- Itani SI, Ruderman NB, Schmieder F, Boden G. Lipid-induced insulin resistance in human muscle is associated with changes in diacylglycerol, protein kinase C, and IkappaB-alpha. Diabetes. 2002;51:2005–2011. - PubMed
Publication types
MeSH terms
Substances
Grants and funding
- R01 DK049230/DK/NIDDK NIH HHS/United States
- P01 DK068229/DK/NIDDK NIH HHS/United States
- P30 DK-45735/DK/NIDDK NIH HHS/United States
- R01 DK-063192/DK/NIDDK NIH HHS/United States
- R01 DK040936/DK/NIDDK NIH HHS/United States
- R01 AG023686/AG/NIA NIH HHS/United States
- P30 DK045735/DK/NIDDK NIH HHS/United States
- R01 DK-49230/DK/NIDDK NIH HHS/United States
- M01 RR-00125/RR/NCRR NIH HHS/United States
- P01 DK-68229/DK/NIDDK NIH HHS/United States
- R01 AG-23686/AG/NIA NIH HHS/United States
- M01 RR000125/RR/NCRR NIH HHS/United States
LinkOut - more resources
Full Text Sources
Other Literature Sources
Medical
Molecular Biology Databases


