Genome-wide association mapping in Arabidopsis identifies previously known flowering time and pathogen resistance genes - PubMed (original) (raw)
doi: 10.1371/journal.pgen.0010060. Epub 2005 Nov 11.
Sung Kim, Keyan Zhao, Erica Bakker, Matthew Horton, Katrin Jakob, Clare Lister, John Molitor, Chikako Shindo, Chunlao Tang, Christopher Toomajian, Brian Traw, Honggang Zheng, Joy Bergelson, Caroline Dean, Paul Marjoram, Magnus Nordborg
Affiliations
- PMID: 16292355
- PMCID: PMC1283159
- DOI: 10.1371/journal.pgen.0010060
Genome-wide association mapping in Arabidopsis identifies previously known flowering time and pathogen resistance genes
María José Aranzana et al. PLoS Genet. 2005 Nov.
Abstract
There is currently tremendous interest in the possibility of using genome-wide association mapping to identify genes responsible for natural variation, particularly for human disease susceptibility. The model plant Arabidopsis thaliana is in many ways an ideal candidate for such studies, because it is a highly selfing hermaphrodite. As a result, the species largely exists as a collection of naturally occurring inbred lines, or accessions, which can be genotyped once and phenotyped repeatedly. Furthermore, linkage disequilibrium in such a species will be much more extensive than in a comparable outcrossing species. We tested the feasibility of genome-wide association mapping in A. thaliana by searching for associations with flowering time and pathogen resistance in a sample of 95 accessions for which genome-wide polymorphism data were available. In spite of an extremely high rate of false positives due to population structure, we were able to identify known major genes for all phenotypes tested, thus demonstrating the potential of genome-wide association mapping in A. thaliana and other species with similar patterns of variation. The rate of false positives differed strongly between traits, with more clinal traits showing the highest rate. However, the false positive rates were always substantial regardless of the trait, highlighting the necessity of an appropriate genomic control in association studies.
Conflict of interest statement
Competing interests. The authors have declared that no competing interests exist.
Figures
Figure 1. Summary of the Data Used in the Study
The columns on the left give the genotype and associated phenotype for four loci, for each of the 95 accessions. The four loci are the flowering time locus FRI (+, wild-type; 1, Ler null allele; 2, Col null allele [9]), for which the associated phenotype is flowering time in long-day conditions without vernalization (late flowering is indicated by height and color of bar), and the three pathogen resistance loci Rps5, Rpm1, and Rps2 (+, wild-type; −, null allele [10,11,12]), for which the associated phenotypes are hypersensitive response to the appropriate bacterial avr gene (red indicates resistance, black indicates susceptibility, and missing data are indicated by missing bar). The tree on the right illustrates the genetic relationships between the accessions [8]. It is clear that phenotypes and genotypes are correlated, genome-wide.
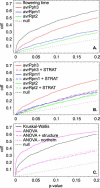
Figure 2. The Genome-Wide Distribution of _p_-Values under Different Scenarios
(A) Cumulative distribution of _p-_values for association tests across approximately 850 loci. The sequenced haplotypes at each locus were treated as alleles (after eliminating singleton polymorphisms), and the significance of genotype–phenotype associations was tested using Kruskal–Wallis tests in the case of flowering time (a continuous trait), and using χ2 tests in the case of resistance (a binary trait). Under the null hypothesis of no association, the cumulative distribution should be a straight line: the observed distributions are all heavily skewed towards zero. (B) The cumulative distribution of _p-_values for association with pathogen resistance, with and without correction for population structure using the program STRAT [13]. The false positive rate is decreased for avrPph3, but is unaffected for the other two phenotypes. (C) The cumulative distribution of _p-_values for association with flowering time, with and without correction for population structure. ANOVA was used instead of the nonparametric Kruskal–Wallis test to make it possible to use population structure as cofactor (cf. [14]). The distribution for ANOVA with accessions from Finland and northern Sweden removed is also shown (“ANOVA − northern”). The false positive rate is decreased using both approaches.
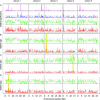
Figure 3. Genome-Wide Scans for Association with Flowering Time and Pathogen Resistance
For flowering time (A), four different statistical methods were used (described in Materials and Methods): Voronoi focusing on “late” alleles (magenta line), Voronoi focusing on “early” alleles (blue line), CLASS (green line), and fragment-based Kruskal–Wallis tests (red line; see also Figure 2). For pathogen resistance (avrRpm1 [B], avrRpt2 [C], and avrPph3 [D]), only the last two tests were used. Higher peaks indicate stronger association (the _y_-axes are proportional to the negative log _p-_values, but have been normalized to the highest value within each test). The dotted lines correspond to the 95% percentile and are mainly intended to facilitate comparison between figures. Yellow vertical lines indicate the positions of the appropriate candidate loci. Peaks occur at these loci for all methods, but are otherwise distributed throughout the genome.
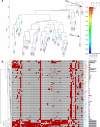
Figure 4. Haplotypes Significantly Associated with Flowering Time Clustered by Haplotype Membership
To help determine which associations were real and which were due to population structure, the most significantly associated haplotypes (based on fragment-wise Kruskal–Wallis; see Materials and Methods) were clustered based on similarity in the list of accessions that carry each haplotype. (A) The tree shows the resulting cluster with tips colored according to average flowering time among the accessions that carry the haplotype corresponding to each tip (the scale is given on the right along with a histogram showing the distribution of flowering time across the 95 accessions). (B) The matrix shows the membership list for each haplotype. Each column corresponds to the haplotype (tip) in the tree above it; accessions highlighted in red carry the haplotype significantly associated with flowering time. The tree thus illustrates the clustering of the columns of the matrix: clustering was done based on pairwise distance as measured by the absolute value of the correlation in membership between columns. Phenotypes of the accessions are given on the right, and the rows of the matrix (i.e., the accessions) have been clustered based on pairwise Hamming distance. It is evident that most of the significant haplotypes, regardless of position in the genome, share similar membership lists that include the accessions from Finland and northern Sweden. On the other hand, the clusters corresponding to the known major alleles of FRI are unique, indicating that these are indeed true positives.
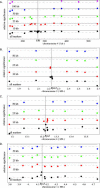
Figure 5. The Strength of Association (Using CLASS) around the Four Candidate Loci for Various Marker Densities
For each locus (FRI [A], Rpm1 [B], Rps2 [C], and Rps5 [D]), the bottom panel shows the pattern of association using all available fragment markers around the locus (the position of which is given by a grey vertical line), and the panels above show the effect of successively reducing the marker density so that no markers are within 10, 25, 50, and 100 kb (FRI only) of the causative polymorphisms. The dotted grey line represents the 95th percentile of all associations across the genome. Because we used an association statistic that utilizes the pattern of haplotype sharing across multiple fragments, the relative significance of any particular fragment may change depending on the presence or absence of other fragments. The FRI region (A) remains strongly associated with flowering time even for the lowest marker density, while the signal of association around the R genes (B–D) disappears as one goes from 10- to 25-kb spacing.
Similar articles
- Linkage and association mapping of Arabidopsis thaliana flowering time in nature.
Brachi B, Faure N, Horton M, Flahauw E, Vazquez A, Nordborg M, Bergelson J, Cuguen J, Roux F. Brachi B, et al. PLoS Genet. 2010 May 6;6(5):e1000940. doi: 10.1371/journal.pgen.1000940. PLoS Genet. 2010. PMID: 20463887 Free PMC article. - Genome-wide association study of 107 phenotypes in Arabidopsis thaliana inbred lines.
Atwell S, Huang YS, Vilhjálmsson BJ, Willems G, Horton M, Li Y, Meng D, Platt A, Tarone AM, Hu TT, Jiang R, Muliyati NW, Zhang X, Amer MA, Baxter I, Brachi B, Chory J, Dean C, Debieu M, de Meaux J, Ecker JR, Faure N, Kniskern JM, Jones JD, Michael T, Nemri A, Roux F, Salt DE, Tang C, Todesco M, Traw MB, Weigel D, Marjoram P, Borevitz JO, Bergelson J, Nordborg M. Atwell S, et al. Nature. 2010 Jun 3;465(7298):627-31. doi: 10.1038/nature08800. Epub 2010 Mar 24. Nature. 2010. PMID: 20336072 Free PMC article. - Understanding the evolution of defense metabolites in Arabidopsis thaliana using genome-wide association mapping.
Chan EK, Rowe HC, Kliebenstein DJ. Chan EK, et al. Genetics. 2010 Jul;185(3):991-1007. doi: 10.1534/genetics.109.108522. Epub 2009 Sep 7. Genetics. 2010. PMID: 19737743 Free PMC article. - Natural genetic variation in Arabidopsis: tools, traits and prospects for evolutionary ecology.
Shindo C, Bernasconi G, Hardtke CS. Shindo C, et al. Ann Bot. 2007 Jun;99(6):1043-54. doi: 10.1093/aob/mcl281. Epub 2007 Jan 26. Ann Bot. 2007. PMID: 17259228 Free PMC article. Review. - Arabidopsis in Madison: genes and phenotypes spread like weeds.
Chasan R. Chasan R. Plant Cell. 1995 Nov;7(11):1737-48. doi: 10.1105/tpc.7.11.1737. Plant Cell. 1995. PMID: 8535131 Free PMC article. Review. No abstract available.
Cited by
- Genome-Wide Association Study Dissects the Genetic Architecture of Maize Husk Tightness.
Jiang S, Zhang H, Ni P, Yu S, Dong H, Zhang A, Cao H, Zhang L, Ruan Y, Cui Z. Jiang S, et al. Front Plant Sci. 2020 Jun 30;11:861. doi: 10.3389/fpls.2020.00861. eCollection 2020. Front Plant Sci. 2020. PMID: 32695127 Free PMC article. - Candidate genes and genetic architecture of symbiotic and agronomic traits revealed by whole-genome, sequence-based association genetics in Medicago truncatula.
Stanton-Geddes J, Paape T, Epstein B, Briskine R, Yoder J, Mudge J, Bharti AK, Farmer AD, Zhou P, Denny R, May GD, Erlandson S, Yakub M, Sugawara M, Sadowsky MJ, Young ND, Tiffin P. Stanton-Geddes J, et al. PLoS One. 2013 May 31;8(5):e65688. doi: 10.1371/journal.pone.0065688. Print 2013. PLoS One. 2013. PMID: 23741505 Free PMC article. - Association of candidate genes with drought tolerance traits in diverse perennial ryegrass accessions.
Yu X, Bai G, Liu S, Luo N, Wang Y, Richmond DS, Pijut PM, Jackson SA, Yu J, Jiang Y. Yu X, et al. J Exp Bot. 2013 Apr;64(6):1537-51. doi: 10.1093/jxb/ert018. Epub 2013 Feb 5. J Exp Bot. 2013. PMID: 23386684 Free PMC article. - Discovery and mapping of a new expressed sequence tag-single nucleotide polymorphism and simple sequence repeat panel for large-scale genetic studies and breeding of Theobroma cacao L.
Allegre M, Argout X, Boccara M, Fouet O, Roguet Y, Bérard A, Thévenin JM, Chauveau A, Rivallan R, Clement D, Courtois B, Gramacho K, Boland-Augé A, Tahi M, Umaharan P, Brunel D, Lanaud C. Allegre M, et al. DNA Res. 2012;19(1):23-35. doi: 10.1093/dnares/dsr039. Epub 2011 Dec 30. DNA Res. 2012. PMID: 22210604 Free PMC article. - Multi-environment GWAS identifies genomic regions underlying grain nutrient traits in foxtail millet (Setaria italica).
Jaiswal V, Bandyopadhyay T, Singh RK, Gahlaut V, Muthamilarasan M, Prasad M. Jaiswal V, et al. Plant Cell Rep. 2023 Dec 21;43(1):6. doi: 10.1007/s00299-023-03127-1. Plant Cell Rep. 2023. PMID: 38127149
References
- Nordborg M, Tavaré S. Linkage disequilibrium: What history has to tell us. Trends Genet. 2002;18:83–90. - PubMed
- Weiss KM, Terwilliger JD. How many diseases does it take to map a gene with SNPs? Nature Genet. 2000;26:151–157. - PubMed
- Zondervan KT, Cardon LR. The complex interplay among factors that influence allelic association. Nature Rev Genet. 2004;5:89–100. - PubMed
- Lander ES, Schork NJ. Genetic dissection of complex traits. Science. 1994;265:2037–2048. - PubMed
- Grupe A, Germer S, Usuka J, Aud D, Belknap JK, et al. In silico mapping of complex disease-related traits in mice. Science. 2001;292:1915–1918. - PubMed
Publication types
MeSH terms
LinkOut - more resources
Full Text Sources
Other Literature Sources
Research Materials


