Genome-scale thermodynamic analysis of Escherichia coli metabolism - PubMed (original) (raw)
Genome-scale thermodynamic analysis of Escherichia coli metabolism
Christopher S Henry et al. Biophys J. 2006.
Abstract
Genome-scale metabolic models are an invaluable tool for analyzing metabolic systems as they provide a more complete picture of the processes of metabolism. We have constructed a genome-scale metabolic model of Escherichia coli based on the iJR904 model developed by the Palsson Laboratory at the University of California at San Diego. Group contribution methods were utilized to estimate the standard Gibbs free energy change of every reaction in the constructed model. Reactions in the model were classified based on the activity of the reactions during optimal growth on glucose in aerobic media. The most thermodynamically unfavorable reactions involved in the production of biomass in E. coli were identified as ATP phosphoribosyltransferase, ATP synthase, methylene-tetra-hydrofolate dehydrogenase, and tryptophanase. The effect of a knockout of these reactions on the production of biomass and the production of individual biomass precursors was analyzed. Changes in the distribution of fluxes in the cell after knockout of these unfavorable reactions were also studied. The methodologies and results discussed can be used to facilitate the refinement of the feasible ranges for cellular parameters such as species concentrations and reaction rate constants.
Figures
FIGURE 1
Effect of transformation of into
The difference between
and
is shown for different reaction molecularities. The difference between
and
depends only on the difference between the number of reactant molecules and the number of product molecules.
FIGURE 2
Thermodynamic feasibility of the reactions in iHJ873. Histograms of values for the essential (A) and substitutable (B) reactions. The values of
for the essential (C) and substitutable (D) reactions. The blue error bars indicate the uncertainty of
calculated, given a 4 kcal/mol uncertainty in
provided in the literature (17). The red error bars indicate the range of values that
could take considering the uncertainty and concentrations in the cell ranging from 20 mM to 10−2 mM. The solid arrows in C mark the reactions for which
− _U_r,est > 0. These reactions must be unfavorable at the reference conditions.
FIGURE 3
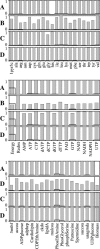
Impact of unfavorable reactions on the yield of biomass precursors. The maximum yields of the individual biomass precursors and of biomass relative to the corresponding maximum yields in the wild-type cells for different reaction knockouts: (A) ATP phosphoribosyltransferase, (B) ATP synthase, (C) methylene-tetra-hydrofolate dehydrogenase, and (D) tryptophanase. The bold lines in the plot show the relative precursor yield required for optimal growth to occur.
FIGURE 4
Impact of simultaneous knockouts of unfavorable reactions on growth and growth-limiting precursors. The maximum yields of biomass (I) and energy (II) for the combinations of simultaneous knockouts of the unfavorable reactions: A, ATP phosphoribosyltransferase, B, ATP synthase, C, methylene-tetra-hydrofolate dehydrogenase, and D, tryptophanase. The maximum yields of biomass (I) are scaled by the maximum yield of biomass in the wild-type. The maximum yields of energy (II) are scaled by the amount of energy required for optimal growth. Not all combinations including knockout of ATP phosphoribosyltransferase (A) are shown because zero growth is possible without ATP phosphoribosyltransferase and energy is not affected by knockout of ATP phosphoribosyltransferase.
References
- Covert, M. W., I. Famili, and B. O. Palsson. 2003. Identifying constraints that govern cell behavior: a key to converting conceptual to computational models in biology. Biotechnol. Bioeng. 84:763–772. - PubMed
- Wiback, S. J., I. Famili, H. J. Greenberg, and B. O. Palsson. 2004. Monte Carlo sampling can be used to determine the size and shape of the steady-state flux space. J. Theor. Biol. 228:437–447. - PubMed
Publication types
MeSH terms
Substances
LinkOut - more resources
Full Text Sources
Other Literature Sources
Molecular Biology Databases


