An algorithmic framework for genome-wide modeling and analysis of translation networks - PubMed (original) (raw)
An algorithmic framework for genome-wide modeling and analysis of translation networks
Amit Mehra et al. Biophys J. 2006.
Abstract
The sequencing of genomes of several organisms and advances in high throughput technologies for transcriptome and proteome analysis has allowed detailed mechanistic studies of transcription and translation using mathematical frameworks that allow integration of both sequence-specific and kinetic properties of these fundamental cellular processes. To understand how perturbations in mRNA levels affect the synthesis of individual proteins within a large protein synthesis network, we consider here a genome-scale codon-wide model of the translation machinery with explicit description of the processes of initiation, elongation, and termination. The mechanistic codon-wide description of the translation process and the large number of mRNAs competing for resources, such as ribosomes, requires the use of novel efficient algorithmic approaches. We have developed such an efficient algorithmic framework for genome-scale models of protein synthesis. The mathematical and computational framework was applied to the analysis of the sensitivity of a translation network to perturbation in the rate constants and in the mRNA levels in the system. Our studies suggest that the highest specific protein synthesis rate (protein synthesis rate per mRNA molecule) is achieved when translation is elongation-limited. We find that the mRNA species with the highest number of actively translating ribosomes exerts maximum control on the synthesis of every protein, and the response of protein synthesis rates to mRNA expression variation is a function of the strength of initiation of translation at different mRNA species. Such quantitative understanding of the sensitivity of protein synthesis to the variation of mRNA expression can provide insights into cellular robustness mechanisms and guide the design of protein production systems.
Figures
FIGURE 1
Schematic of the translational machinery. Translation comprises three key steps: initiation, elongation, and termination. The value n is the length of the mRNA template; γ and β are the scaled initiation and termination rate constants, respectively; λ is the ribosomal binding affinity; and L is the number of codons occupied by a ribosome.
FIGURE 2
The objective of the outer problem, is a convex function of the fraction of free ribosomes, r. Convexity of the objective allows use of bisection method to estimate the fraction of free ribosomes.
FIGURE 3
Diagrammatic description of the bilevel algorithmic framework.
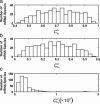
FIGURE 4
Distribution of sensitivities of protein synthesis rates from all mRNA species to their initiation (a), elongation (b), and termination (c) rate constants, respectively.
FIGURE 5
The elongation-limited mRNA species have higher protein synthesis rates than the initiation-limited mRNA species. (a) Sensitivity of the protein synthesis rates from every mRNA species to their initiation (+), elongation (□), and termination (•) rate constants as a function of ribosome density, ρ (the fraction of the mRNA covered by ribosomes). (b) Specific scaled protein synthesis rates from every mRNA species as a function of ribosome density, ρ.
FIGURE 6
Distribution of fold changes in protein synthesis rate from unperturbed mRNA species in response to (a) overexpression by fivefold of the mRNA species with low expression levels, and (b) underexpression by fivefold of the mRNA species with high expression levels.
FIGURE 7
Distribution of relative changes in the number of free ribosomes to changes in mRNA concentration estimated by increasing (a) or decreasing (b) the number of copies of each mRNA species by 1. (c) Relative changes in number of free ribosomes to increase (□) or decrease (×) in mRNA concentration is a linear function of the number of ribosomes associated with each mRNA.
FIGURE 8
Relative changes in the rates of protein synthesis from all unperturbed mRNAs,
as a function of the polysome size of the perturbed mRNA species. The perturbations correspond to an increase in the number of an individual mRNA species by one copy.
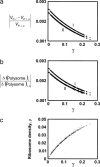
FIGURE 9
Relative changes in rate of protein synthesis from all mRNA species (a), and relative changes in the polysome size of each mRNA species (b), in response to a change in the concentration of the mRNA species with highest polysome size are a function of the scaled initiation rate constant, γ. Relative changes are calculated by increasing (I, ○) or decreasing (II, ⋄) the number of the mRNA species with highest polysome size by one copy. The ribosome density of each mRNA species is an increasing function of its scaled initiation rate constant, γ (c).
Similar articles
- Noise analysis of genome-scale protein synthesis using a discrete computational model of translation.
Racle J, Stefaniuk AJ, Hatzimanikatis V. Racle J, et al. J Chem Phys. 2015 Jul 28;143(4):044109. doi: 10.1063/1.4926536. J Chem Phys. 2015. PMID: 26233109 - Insights into the relation between mRNA and protein expression patterns: I. Theoretical considerations.
Mehra A, Lee KH, Hatzimanikatis V. Mehra A, et al. Biotechnol Bioeng. 2003 Dec 30;84(7):822-33. doi: 10.1002/bit.10860. Biotechnol Bioeng. 2003. PMID: 14708123 - Optimizing scaleup yield for protein production: Computationally Optimized DNA Assembly (CODA) and Translation Engineering.
Hatfield GW, Roth DA. Hatfield GW, et al. Biotechnol Annu Rev. 2007;13:27-42. doi: 10.1016/S1387-2656(07)13002-7. Biotechnol Annu Rev. 2007. PMID: 17875472 Review. - A model for protein translation: polysome self-organization leads to maximum protein synthesis rates.
Zouridis H, Hatzimanikatis V. Zouridis H, et al. Biophys J. 2007 Feb 1;92(3):717-30. doi: 10.1529/biophysj.106.087825. Epub 2006 Nov 10. Biophys J. 2007. PMID: 17098800 Free PMC article. - Controlling translation elongation efficiency: tRNA regulation of ribosome flux on the mRNA.
Gorgoni B, Marshall E, McFarland MR, Romano MC, Stansfield I. Gorgoni B, et al. Biochem Soc Trans. 2014 Feb;42(1):160-5. doi: 10.1042/BST20130132. Biochem Soc Trans. 2014. PMID: 24450645 Review.
Cited by
- Ribosomal computing: implementation of the computational method.
Chatterjee P, Ghosal P, Shit S, Biswas A, Mallik S, Allabun S, Othman M, Ali AH, Elshiekh E, Soufiene BO. Chatterjee P, et al. BMC Bioinformatics. 2024 Oct 3;25(1):321. doi: 10.1186/s12859-024-05945-w. BMC Bioinformatics. 2024. PMID: 39358680 Free PMC article. - Modeling the ribosomal small subunit dynamic in Saccharomyces cerevisiae based on TCP-seq data.
Neumann T, Tuller T. Neumann T, et al. Nucleic Acids Res. 2022 Feb 22;50(3):1297-1316. doi: 10.1093/nar/gkac021. Nucleic Acids Res. 2022. PMID: 35100399 Free PMC article. - Predictive biophysical modeling and understanding of the dynamics of mRNA translation and its evolution.
Zur H, Tuller T. Zur H, et al. Nucleic Acids Res. 2016 Nov 2;44(19):9031-9049. doi: 10.1093/nar/gkw764. Epub 2016 Sep 2. Nucleic Acids Res. 2016. PMID: 27591251 Free PMC article. - Analysis of Translation Elongation Dynamics in the Context of an Escherichia coli Cell.
Vieira JP, Racle J, Hatzimanikatis V. Vieira JP, et al. Biophys J. 2016 May 10;110(9):2120-31. doi: 10.1016/j.bpj.2016.04.004. Biophys J. 2016. PMID: 27166819 Free PMC article. - Predicting translation initiation rates for designing synthetic biology.
Reeve B, Hargest T, Gilbert C, Ellis T. Reeve B, et al. Front Bioeng Biotechnol. 2014 Jan 20;2:1. doi: 10.3389/fbioe.2014.00001. eCollection 2014. Front Bioeng Biotechnol. 2014. PMID: 25152877 Free PMC article. Review.
References
- Miller, O. L., Jr., B. A. Hamkalo, and C. A. Thomas, Jr. 1970. Visualization of bacterial genes in action. Science. 169:392–395. - PubMed
- Brown, P. O., and D. Botstein. 1999. Exploring the new world of the genome with DNA microarrays. Nat. Genet. 21:33–37. - PubMed
- Lockhart, D. J., and E. A. Winzeler. 2000. Genomics, gene expression and DNA arrays. Nature. 405:827–836. - PubMed
- Selinger, D. W., K. J. Cheung, R. Mei, E. M. Johansson, C. S. Richmond, F. R. Blattner, D. J. Lockhart, and G. M. Church. 2000. RNA expression analysis using a 30-basepair resolution Escherichia coli genome array. Nat. Biotechnol. 18:1262–1268. - PubMed
- Anderson, N. L., and N. G. Anderson. 1998. Proteome and proteomics: new technologies, new concepts, and new words. Electrophoresis. 19:1853–1861. - PubMed
Publication types
MeSH terms
Substances
LinkOut - more resources
Full Text Sources


