Pleiotropic effects of FGFR1 on cell proliferation, survival, and migration in a 3D mammary epithelial cell model - PubMed (original) (raw)
Pleiotropic effects of FGFR1 on cell proliferation, survival, and migration in a 3D mammary epithelial cell model
Wa Xian et al. J Cell Biol. 2005.
Abstract
Members of the fibroblast growth factor (FGF) family and the FGF receptors (FGFRs) have been implicated in mediating various aspects of mammary gland development and transformation. To elucidate the molecular mechanisms of FGFR1 action in a context that mimics polarized epithelial cells, we have developed an in vitro three-dimensional HC11 mouse mammary epithelial cell culture model expressing a drug-inducible FGFR1 (iFGFR1). Using this conditional model, iFGFR1 activation in these growth-arrested and polarized mammary acini initially led to reinitiation of cell proliferation, increased survival of luminal cells, and loss of cell polarity, resulting in the disruption of acinar structures characterized by the absence of an empty lumen. iFGFR1 activation also resulted in a gain of invasive properties and the induction of matrix metalloproteinase 3 (MMP-3), causing the cleavage of E-cadherin and increased expression of smooth muscle actin and vimentin. The addition of a pan MMP inhibitor abolished these phenotypes but did not prevent the effects of iFGFR1 on cell proliferation or survival.
Figures
Figure 1.
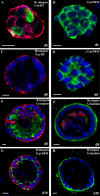
HC11 cells form polarized, growth-arrested acini when cultured on a basement membrane matrix. Representative confocal microscopic images are shown. Day 6 HC11 acini were immunostained with antiserum to p-histone H3 (A, green) and α6 integrin (A, red) or p-ERM (B, green). Day 8 HC11 acini were immunostained with antiserum to p-histone H3 (C, green) and α6 integrin (C, red), p-ERM (D, green), cleaved caspase 3 (E, green) and α6 integrin (E, red), and laminin V (F, green) and cleaved caspase 3 (F, red). Day 10 HC11 acini were immunostained with antiserum to α6 integrin (G, red) and p-ERM (G, green) and to laminin V (H, green). Bars, 10 μm.
Figure 2.
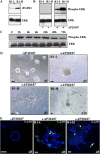
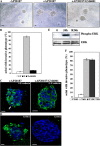
iFGFR1 activation alters HC11 acinar morphogenesis. (A) Two stable clones of HC11 cells expressing different levels of iFGFR1 (R1-L and -H) were examined by immunoblotting with anti–HA epitope antibody. (B) ERK activation of two clones was assessed by immunoblotting with anti–p-ERK after treatment with AP20187 for 30 min. Equal loading of protein on the blot was determined by reprobing the membrane with anti-ERK antibody. (C) Time course of ERK activation after iFGFR1 induction was examined by immunoblotting using anti–p-ERK antibody. ERK is shown as a control for equal protein loading. The two clones gave similar results, so only R1-L is shown here. (D) 10-d-old iFGFR1 acini were treated with (+) or without (−) AP20187 for 5 or 10 d. Brightfield images are shown. Bars, 50 μm. (E) Confocal images of acinar cultures treated for 5 d and immunostained by anti–p-histone H3 (green) are shown. TOPRO-3 (blue) labeled the nuclei. The arrow indicates where cells continued to proliferate and invade the matrix, which was observed after 5 d of treatment. Bars, 25 μm.
Figure 3.
iFGFR1 activation inhibits luminal apoptosis, induces proliferation, promotes cell invasion, and disrupts cell polarity. Two clones gave similar results, so only representative images of R1-L are shown here. For each antibody staining, ∼70 structures from three independent experiments were examined, and ∼85% of them displayed the similar phenotypes. (A) Day 10 iFGFR1 acini were either not treated (−) or treated (+) with AP20187 for 24 h. Representative confocal images of structures immunostained with anti–p-Akt (Ser 473; a and b, green) or anti–p-histone H3 (c and d, green) and anti–α6 integrin (c and d, red) are shown. (B) Day 10 iFGFR1 acini either not treated or treated with AP20187 for 5 d. Representative confocal images of structures immunostained with antibodies against p-ERM (a and b, green), α6 integrin (c and d, red) and p-histone H3 (c and d, green), or cleaved caspase 3 (e and f, green) are shown. TOPRO-3 stained the nuclei (blue). Bars, 25 μm. (C) Quantitation of p-histone H3 staining of untreated (UT), 24-h treated (T1D), and 5-d treated (T5D) acini. The total number of nuclei and the number of nuclei staining positive for p-histone H3 were counted in 74 untreated acini, 83 24-h–treated acini, and 76 5-d–treated acini. Using these numbers, the percentage of p-histone H3–positive cells was calculated. The data are presented as the mean and SEM of fold change in the percentage of p-histone H3 positively staining cells among these three groups from three independent experiments.
Figure 4.
iFGFR1 activation promotes EMT. 10-d-old iFGFR1 acini were cultured in the media with (+) or without (−) AP20187 for 5 d. Two clones displayed similar EMT phenotype after treatment, so only representative images of R1-L are shown here. Approximately 90 structures from three independent experiments were examined, and ∼80% of them displayed the similar phenotypes. Structures were immunostained with antibodies against E-cadherin (A, green), β-catenin (B, green), SMA (C [a and b], green) and p-histone H3 (C [a and b], red), or vimentin (C, c). TOPRO-3 (blue) marked the nuclei. Arrows indicate where E-cadherin and β-catenin have dissociated from the cell membrane. Bars, 25 μm.
Figure 5.
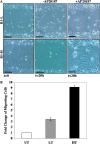
iFGFR1 activation in HC11 cells induces migration. (A) Phase-contrast images of wound closure of R1-L and -H cells that were incubated in medium with (+) or without (−) AP20187 for 20 h. These images are representative of three separate experiments. Bars, 20 μm. (B) R1-L and -H cells were induced to migrate toward serum. The migration ability was calculated by dividing the total number of migrating cells of treated R1-L (LT) and -H cells (HT) by the number of untreated cells (UT) that migrated. Each bar represents the mean and SEM of samples measured in triplicate.
Figure 6.
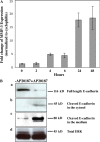
iFGFR1 activation induces MMP-3 expression and triggers cleavage of E-cadherin. (A) Quantitative RT-PCR demonstrates MMP3 induction after iFGFR1 activation in R1-L cells. The mean and SEM from four independent experiments are shown. (B) iFGFR1 cells cultured on tissue culture plastic were serum starved for 16 h and then treated with AP20187 or ethanol solvent for 4 d. Two clones showed similar results, so only R1-L results are shown here. (a) Total levels of cytoskeleton-associated E-cadherin were detected by immunoblotting of lysates using DECMA-1 antibody. (b) Cleaved E-cadherin in the cytosol was detected by immunoblotting using an anti–E-cadherin antibody recognizing the cytoplasmic tail of E-cadherin. (c) The extracellular fragment of E-cadherin found in the conditioned medium was detected using the DECMA-1 antibody. (d) ERK is shown as a control for equal protein loading.
Figure 7.
EMT resulting from iFGFR1 activation in HC11 acini is dependent on MMP activity and is not reversible. Two clones showed similar results, so only R1-L results are shown here. (A) 10-d-old iFGFR1 acini were treated (+) or not treated (−) with AP20187 and the MMP inhibitor GM6001 for 5 d. Brightfield images of acini are shown. Bars, 25 μm. (B) Quantitation of invasive phenotypes of iFGFR1 acini in the absence of AP20187 (UT), in the presence of AP20187 (T), or in the presence of AP20187 and GM6001 (T+MMPi). The mean and SEM from three independent experiments are shown. (C and D) Confocal images of day 10 iFGFR1 acini treated with AP20187 (+AP20187) or with AP20187 and GM6001 (+AP20187/GM6001) for 5 d. Structures were stained with TOPRO-3 (C, blue) and anti–E-cadherin (C, green) or with anti-SMA (D, green). Arrow indicates where E-cadherin expression became punctate or lost. Bars, 25 μm. (E) ERK activation of R1 cells induced with AP20187 for 24 h and then withdrawn (R24h) or not (24h) was assessed by immunoblotting with anti–p-ERK. Equal loading of protein on the blot was determined by reprobing the membrane with anti-ERK antibody. (F) Quantitation of invasive phenotypes of iFGFR1 acini that were untreated (UT6D), treated for 6 d (T6D), or withdrawn from AP20187 for 5 d after a 24-h induction (T1DUT5D). The means and SEMs from three independent experiments are shown.
Figure 8.
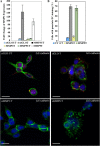
Suppression of MMP-3 expression inhibits E-cadherin cleavage. (A) Quantitative RT-PCR demonstrates MMP-3 expression and induction after iFGFR1 activation (in hours) were significantly reduced in R1 cells transfected with MMP-3 siRNA pool but not with MMP-9 siRNA pool or siGLO control siRNA. The mean and SEM from three independent experiments are shown. (B) Quantitation of E-cadherin punctate staining of untreated iFGFR1 cells transfected with siGLO and AP20187-treated iFGFR1 cells transfected with siGLO, MMP-3 siRNA, or MMP-9 siRNA. The mean and SEM from three independent experiments are shown. (C) Confocal images of the cells immunostained with anti–E-cadherin (green). TOPRO-3 marked the nuclei (blue). siGLO control siRNA displays red fluorescence signal. Bars, 10 μm.
Figure 9.
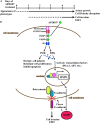
Model for iFGFR1-induced cell invasion and EMT in HC11 3D culture system. (A) Two distinct stages of phenotypic progression were observed in an HC11 3D culture system after iFGFR1 activation. The dashed line suggests that the phenotypes are still progressing, and the solid line indicates that the phenotypes have been established. (B) Conditional dimerization of the iFGFR1 fusion protein by AP20187 activated several downstream signaling pathways, which may eventually lead to cell polarity disruption, acinar growth, invasive phenotypes, and EMT.
Similar articles
- Distinct roles of fibroblast growth factor receptor 1 and 2 in regulating cell survival and epithelial-mesenchymal transition.
Xian W, Schwertfeger KL, Rosen JM. Xian W, et al. Mol Endocrinol. 2007 Apr;21(4):987-1000. doi: 10.1210/me.2006-0518. Epub 2007 Feb 6. Mol Endocrinol. 2007. PMID: 17284663 - TNFAIP3 is required for FGFR1 activation-promoted proliferation and tumorigenesis of premalignant DCIS.COM human mammary epithelial cells.
Yang M, Yu X, Li X, Luo B, Yang W, Lin Y, Li D, Gan Z, Xu J, He T. Yang M, et al. Breast Cancer Res. 2018 Aug 15;20(1):97. doi: 10.1186/s13058-018-1024-9. Breast Cancer Res. 2018. PMID: 30111373 Free PMC article. - Interleukin-1beta and fibroblast growth factor receptor 1 cooperate to induce cyclooxygenase-2 during early mammary tumourigenesis.
Reed JR, Leon RP, Hall MK, Schwertfeger KL. Reed JR, et al. Breast Cancer Res. 2009;11(2):R21. doi: 10.1186/bcr2246. Epub 2009 Apr 24. Breast Cancer Res. 2009. PMID: 19393083 Free PMC article. - Transforming growth factor-beta-induced epithelial-mesenchymal transition in the lens: a model for cataract formation.
de Iongh RU, Wederell E, Lovicu FJ, McAvoy JW. de Iongh RU, et al. Cells Tissues Organs. 2005;179(1-2):43-55. doi: 10.1159/000084508. Cells Tissues Organs. 2005. PMID: 15942192 Review. - Use of three-dimensional basement membrane cultures to model oncogene-induced changes in mammary epithelial morphogenesis.
Shaw KR, Wrobel CN, Brugge JS. Shaw KR, et al. J Mammary Gland Biol Neoplasia. 2004 Oct;9(4):297-310. doi: 10.1007/s10911-004-1402-z. J Mammary Gland Biol Neoplasia. 2004. PMID: 15838601 Free PMC article. Review.
Cited by
- P190B RhoGAP has pro-tumorigenic functions during MMTV-Neu mammary tumorigenesis and metastasis.
McHenry PR, Sears JC, Herrick MP, Chang P, Heckman-Stoddard BM, Rybarczyk M, Chodosh LA, Gunther EJ, Hilsenbeck SG, Rosen JM, Vargo-Gogola T. McHenry PR, et al. Breast Cancer Res. 2010;12(5):R73. doi: 10.1186/bcr2643. Epub 2010 Sep 22. Breast Cancer Res. 2010. PMID: 20860838 Free PMC article. - A computational study of the development of epithelial acini: II. Necessary conditions for structure and lumen stability.
Rejniak KA, Anderson AR. Rejniak KA, et al. Bull Math Biol. 2008 Jul;70(5):1450-79. doi: 10.1007/s11538-008-9308-3. Epub 2008 Apr 10. Bull Math Biol. 2008. PMID: 18401665 Free PMC article. - Three interrelated themes in current breast cancer research: gene addiction, phenotypic plasticity, and cancer stem cells.
Cardiff RD, Couto S, Bolon B. Cardiff RD, et al. Breast Cancer Res. 2011 Oct 25;13(5):216. doi: 10.1186/bcr2887. Breast Cancer Res. 2011. PMID: 22067349 Free PMC article. Review. - Co-amplified genes at 8p12 and 11q13 in breast tumors cooperate with two major pathways in oncogenesis.
Kwek SS, Roy R, Zhou H, Climent J, Martinez-Climent JA, Fridlyand J, Albertson DG. Kwek SS, et al. Oncogene. 2009 Apr 30;28(17):1892-903. doi: 10.1038/onc.2009.34. Epub 2009 Mar 30. Oncogene. 2009. PMID: 19330026 Free PMC article. - Sprouty genes regulate activated fibroblasts in mammary epithelial development and breast cancer.
Li J, Ma R, Wang X, Lu Y, Chen J, Feng D, Zhou J, Xia K, Klein O, Xie H, Lu P. Li J, et al. Cell Death Dis. 2024 Apr 10;15(4):256. doi: 10.1038/s41419-024-06637-2. Cell Death Dis. 2024. PMID: 38600092 Free PMC article.
References
- Bates, R.C., and A.M. Mercurio. 2005. The epithelial-mesenchymal transition (EMT) and colorectal cancer progression. Cancer Biol. Ther. 4:365–370. - PubMed
- Berx, G., A.M. Cleton-Jansen, K. Strumane, W.J. de Leeuw, F. Nollet, F. van Roy, and C. Cornelisse. 1996. E-cadherin is inactivated in a majority of invasive human lobular breast cancers by truncation mutations throughout its extracellular domain. Oncogene. 13:1919–1925. - PubMed
- Birchmeier, W., and C. Birchmeier. 1995. Epithelial-mesenchymal transitions in development and tumor progression. EXS. 74:1–15. - PubMed
- Bracke, M.E., F.M. Van Roy, and M.M. Mareel. 1996. The E-cadherin/catenin complex in invasion and metastasis. Curr. Top. Microbiol. Immunol. 213:123–161. - PubMed
Publication types
MeSH terms
Substances
Grants and funding
- R37 CA016303/CA/NCI NIH HHS/United States
- CA 97676-01/CA/NCI NIH HHS/United States
- R01 CA016303/CA/NCI NIH HHS/United States
- CA16303/CA/NCI NIH HHS/United States
- F32 CA097676/CA/NCI NIH HHS/United States
LinkOut - more resources
Full Text Sources
Other Literature Sources
Miscellaneous
