Where CD4+CD25+ T reg cells impinge on autoimmune diabetes - PubMed (original) (raw)
Where CD4+CD25+ T reg cells impinge on autoimmune diabetes
Zhibin Chen et al. J Exp Med. 2005.
Abstract
Foxp3 is required for the generation and activity of CD4(+)CD25(+) regulatory T (T reg) cells, which are important controllers of autoimmunity, including type-1 diabetes. To determine where T reg cells affect the diabetogenic cascade, we crossed the Foxp3 scurfy mutation, which eliminates T reg cells, with the BDC2.5 T cell receptor (TCR) transgenic mouse line. In this model, the absence of T reg cells did not augment the initial activation or phenotypic characteristics of effector T cells in the draining lymph nodes, nor accelerate the onset of T cell infiltration of the pancreatic islets. However, this insulitis was immediately destructive, causing a dramatic progression to overt diabetes. Microarray analysis revealed that T reg cells in the insulitic lesion adopted a gene expression program different from that in lymph nodes, whereas T reg cells in draining or irrelevant lymph nodes appeared very similar. Thus, T reg cells primarily impinge on autoimmune diabetes by reining in destructive T cells inside the islets, more than during the initial activation in the draining lymph nodes.
Figures
Figure 1.
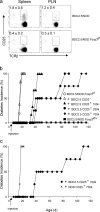
Very early diabetes onset in Foxp3-deficient BDC2.5/NOD mice. (left) Diabetes development in BDC2.5/NOD.Foxp3 sf mice (n = 20) compared with BDC2.5/NOD (n = 21) or BDC2.5/NOD.Foxp3 sf/+ (n = 25) littermates. (middle) Incidence of diabetes in BDC2.5/NOD.Rag o/o mice (n = 8) compared with that in BDC2.5/NOD.Rag + /o controls (n = 7). (right) Diabetes development in BDC2.5/NOD.Rag o/o Foxp3sf and BDC2.5/NOD.Rag o/o littermates (n = 6 in each group).
Figure 2.
A deficit in T reg cells in Foxp3-deficient BDC2.5/NOD mice caused accelerated diabetes. (a) The T reg deficiency in BDC2.5/NOD.Foxp3 sf mice. CD4+CD25+ T cells from 12-d-old BDC2.5/NOD.Foxp3 sf and BDC2.5/NOD littermates were enumerated by flow cytometry. Plots were gated on lymphoid, CD4+CD8−CD69−B220−CD11b−7AAD− cells. Each group consisted of four to five mice from two to three independent experiments. The number within the plot refers to the mean percentage (±SD) of cells in the counting gate. (b) Treatment with antigen-specific T reg cells from BDC2.5/NOD mice rescued BDC/NOD.Foxp3 sf mice from early diabetes. (c) Nonspecific T reg cells from NOD mice were not effective in suppressing diabetes in BDC2.5/NOD.Foxp3 sf mice. The CD25− group represents a composite of five BDC2.5/NOD.Foxp3 sf mice injected with 7 × 10⁵ BDC2.5 cells and three mice with 105 cells. Each of the CD25+ groups consists of four to six animals. The BDC2.5/NOD.Foxp3 sf/+ group consists of 15 mice.
Figure 3.
Naturally occurring T reg cells did not suppress initial T cell activation. Similar kinetics of T cell activation in the PLN of BDC2.5/NOD and BDC2.5/NOD.Foxp3 sf littermates, as indicated by the percentage of cells expressing CD44 and CD69 activation markers. Gated on either CD4+ (a and b) or BDC2.5 clonotypehi T cells (c). Cells from the nondraining MLNs were used as negative controls; b and c derive from independent experiments. Each dot represents one animal.
Figure 4.
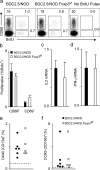
T reg cells did not suppress T cell proliferation, Th1–cytokine production, costimulatory molecule, and chemokine receptor expression in the PLN. (a) Representative plots for BrdU incorporation analysis. Each group consists of five to eight mice. The PLN from mice that did not receive BrdU (right) served as a negative control. The numbers in the plots are percentages of the gated population. Plots are derived from BDC2.5 clonotypehiCD8−B220−CD11b− population. (b) Percentages (mean ± SD) of BrdU-labeled cells in the CD69+ and CD69− subsets shown in panel a. (c and d) PCR Quantification of IL2 (c) and IFNγ (d) mRNA in BDC2.5 clonotypehiCD25− from the PLN of 15-d-old BDC2.5/NOD versus BDC2.5/NOD.Foxp3 sf mice. Data are from two experiments with five mice in each group. (e and f) Frequencies of BDC2.5 clonotypehi cells expressing the costimulatory molecule CD134 (OX40) and chemokine receptor CD195 (CCR5), respectively, in the PLN of 15-d-old BDC2.5/NOD versus BDC2.5/NOD.Foxp3 sf mice. The dashed line indicates background staining. Each dot represents one animal.
Figure 5.
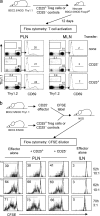
Transferred T reg cells did not inhibit the activation and proliferation of effector T cells in the PLN. (a) CD4+CD25+ or CD4+CD25− cells isolated from Thy1.1 congenic BDC2.5/NOD mice were transferred to 3-d-old BDC2.5/NOD.Foxp3 sf mice, and the activation of endogenous Thy1.2+ T cells in the PLN was analyzed at day 15. The numbers indicate the percentage of cells in the respective counting gate. Plots are gated on lymphoid, B220−CD8− cells. Data represent three experiments with four to five mice in each group receiving 105 or 2.5 × 10⁵ cells. (b) CD25− T cells from Thy1.1-congenic BDC2.5/NOD mice were labeled with CFSE, and were injected alone, or were mixed with CD4+CD25+ or CD4+CD25− cells from BDC2.5/NOD mice at a 10:1 or 3:1 ratio, into standard NOD mice. Dilution of CFSE in the transferred Thy1.1+ effectors in the PLN or inguinal LN was analyzed from 52 to 70 h after injection. The numbers within the plots indicate the percentages of cells that exhibit CFSE dilution. Data are from three experiments.
Figure 6.
Naturally occurring T reg cells regulated the aggressiveness of insulitis. (a) Precipitous progression of Insulitis in Foxp3-deficient BDC2.5/NOD mice. Pancreatic sections stained with hematoxylin and eosin (original magnification, 200), representative of four to five mice in each group. (b) Scores of insulitis at 12 and 15 d old. Each bar represents one animal.
Figure 7.
Gene expression profiles of T reg cells in the respectful insulitic lesion and in lymph nodes. (a) Sorting gates for the CD4+CD25+ or CD4+CD25− cells isolated from MLNs or PLNs, or from the pancreatic infiltrate. (b) Definition of the T reg signature. Genes were identified by comparing microarray datasets from the pairwise comparison of populations shown in panel a (left boxes) or from published datasets: lymph node GFP+CD25+ T reg cells versus naive GFP-CD25− cells from the Foxp3 gfp knockin mice (33), or CD103+CD25+ versus CD103+CD25− cells from B6 mice (reference 34). Genes detected as differentially expressed in two of the three datasets were included in the signature gene set. (c) Biparameter plots comparing expression values of genes from the T reg signature in T reg cells of the MLNs, PLNs, or pancreatic infiltrate. The number of genes over- or underexpressed in either condition is shown in the plot.
Figure 8.
Nature of the genes that distinguish T reg cells in the pancreatic infiltrate. (a) The biparameter plots show, for all genes of the T reg signature, the ratio of expression values in T reg or T conv cells (T reg/T conv, x-axis) versus the ratio of expression in pancreatic infiltrate T reg cells versus MLN T reg cells (right); as a control, the ratio between T reg cells in PLN and MLN is shown on the left. (b) Nature of the genes whose expression is altered in T reg cells of the pancreatic infiltrate relative to LNs T reg cells. The first three columns give the ratio of expression in T reg cells versus conventional CD4+ cells of the MLN or pancreas (Tr/Tc MLN and Tr/Tc Panc, respectively), and the ratio of pancreatic versus MLN T reg cells (Tr Pa/LN). The NCBI gene symbol is used, along with the NCBI GeneID identifier. Yellow and orange highlights denote genes overexpressed by >1.35- or 2.5-fold, respectively; blue highlight denotes underexpression by ⩽0.6 fold.
Similar articles
- Functional waning of naturally occurring CD4+ regulatory T-cells contributes to the onset of autoimmune diabetes.
Tritt M, Sgouroudis E, d'Hennezel E, Albanese A, Piccirillo CA. Tritt M, et al. Diabetes. 2008 Jan;57(1):113-23. doi: 10.2337/db06-1700. Epub 2007 Oct 10. Diabetes. 2008. PMID: 17928397 - Dendritic cell-expanded, islet-specific CD4+ CD25+ CD62L+ regulatory T cells restore normoglycemia in diabetic NOD mice.
Tarbell KV, Petit L, Zuo X, Toy P, Luo X, Mqadmi A, Yang H, Suthanthiran M, Mojsov S, Steinman RM. Tarbell KV, et al. J Exp Med. 2007 Jan 22;204(1):191-201. doi: 10.1084/jem.20061631. Epub 2007 Jan 8. J Exp Med. 2007. PMID: 17210729 Free PMC article. - Characteristics of rat CD4(+)CD25(+) T cells and their ability to prevent not only diabetes but also insulitis in an adoptive transfer model in BB rats.
Holm TL, Lundsgaard D, Markholst H. Holm TL, et al. Scand J Immunol. 2006 Jul;64(1):17-29. doi: 10.1111/j.1365-3083.2006.01760.x. Scand J Immunol. 2006. PMID: 16784487 - Control of type 1 autoimmune diabetes by naturally occurring CD4+CD25+ regulatory T lymphocytes in neonatal NOD mice.
Piccirillo CA, Tritt M, Sgouroudis E, Albanese A, Pyzik M, Hay V. Piccirillo CA, et al. Ann N Y Acad Sci. 2005 Jun;1051:72-87. doi: 10.1196/annals.1361.048. Ann N Y Acad Sci. 2005. PMID: 16126946 Review. - Control of type 1 diabetes by CD4+Foxp3+ regulatory T cells: lessons from mouse models and implications for human disease.
Sgouroudis E, Piccirillo CA. Sgouroudis E, et al. Diabetes Metab Res Rev. 2009 Mar;25(3):208-18. doi: 10.1002/dmrr.945. Diabetes Metab Res Rev. 2009. PMID: 19214972 Review.
Cited by
- Immunomodulation of antigen presenting cells promotes natural regulatory T cells that prevent autoimmune diabetes in NOD mice.
Richer MJ, Lavallée DJ, Shanina I, Horwitz MS. Richer MJ, et al. PLoS One. 2012;7(2):e31153. doi: 10.1371/journal.pone.0031153. Epub 2012 Feb 15. PLoS One. 2012. PMID: 22355341 Free PMC article. - Tissue resident regulatory T cells: novel therapeutic targets for human disease.
Zhou X, Tang J, Cao H, Fan H, Li B. Zhou X, et al. Cell Mol Immunol. 2015 Sep;12(5):543-52. doi: 10.1038/cmi.2015.23. Epub 2015 Apr 20. Cell Mol Immunol. 2015. PMID: 25891216 Free PMC article. Review. - Immune tolerance induction by integrating innate and adaptive immune regulators.
Suzuki J, Ricordi C, Chen Z. Suzuki J, et al. Cell Transplant. 2010;19(3):253-68. doi: 10.3727/096368909X480314. Epub 2009 Nov 16. Cell Transplant. 2010. PMID: 19919733 Free PMC article. Review. - Regulatory T cells fail to suppress CD4T+-bet+ T cells in relapsing multiple sclerosis patients.
Frisullo G, Nociti V, Iorio R, Patanella AK, Caggiula M, Marti A, Sancricca C, Angelucci F, Mirabella M, Tonali PA, Batocchi AP. Frisullo G, et al. Immunology. 2009 Jul;127(3):418-28. doi: 10.1111/j.1365-2567.2008.02963.x. Epub 2008 Nov 7. Immunology. 2009. PMID: 19016907 Free PMC article. - Type I diabetes-associated tolerogenic properties of interleukin-2.
Chentoufi AA, Gaudreau S, Nguyen A, Sabha M, Amrani A, Elghazali G. Chentoufi AA, et al. Clin Dev Immunol. 2011;2011:289343. doi: 10.1155/2011/289343. Epub 2011 May 10. Clin Dev Immunol. 2011. PMID: 21647403 Free PMC article.
References
- Katz, J.D., B. Wang, K. Haskins, C. Benoist, and D. Mathis. 1993. Following a diabetogenic T cell from genesis through pathogenesis. Cell. 74:1089–1100. - PubMed
- Gonzalez, A., I. Andre-Schmutz, C. Carnaud, D. Mathis, and C. Benoist. 2001. Damage control, rather than unresponsiveness, effected by protective DX5+ T cells in autoimmune diabetes. Nat. Immunol. 2:1117–1125. - PubMed
Publication types
MeSH terms
Substances
LinkOut - more resources
Full Text Sources
Other Literature Sources
Medical
Molecular Biology Databases
Research Materials


