Energy inhibition elevates beta-secretase levels and activity and is potentially amyloidogenic in APP transgenic mice: possible early events in Alzheimer's disease pathogenesis - PubMed (original) (raw)
Energy inhibition elevates beta-secretase levels and activity and is potentially amyloidogenic in APP transgenic mice: possible early events in Alzheimer's disease pathogenesis
Rodney A Velliquette et al. J Neurosci. 2005.
Erratum in
- J Neurosci. 2006 Feb 15;26(7):2140-2
Abstract
Beta-secretase [beta-site amyloid precursor protein-cleaving enzyme 1 (BACE1)] is the key rate-limiting enzyme for the production of the beta-amyloid (Abeta) peptide involved in the pathogenesis of Alzheimer's disease (AD). BACE1 levels and activity are increased in AD brain and are likely to drive Abeta overproduction, but the cause of BACE1 elevation in AD is unknown. Interestingly, cerebral glucose metabolism and blood flow are both reduced in preclinical AD, suggesting that impaired energy production may be an early pathologic event in AD. To determine whether reduced energy metabolism would cause BACE1 elevation, we used pharmacological agents (insulin, 2-deoxyglucose, 3-nitropropionic acid, and kainic acid) to induce acute energy inhibition in C57/B6 wild-type and amyloid precursor protein (APP) transgenic (Tg2576) mice. Four hours after treatment, we observed that reduced energy production caused a approximately 150% increase of cerebral BACE1 levels compared with control. Although this was a modest increase, the effect was long-lasting, because levels of the BACE1 enzyme remained elevated for at least 7 d after a single dose of energy inhibitor. In Tg2576 mice, levels of the BACE1-cleaved APP ectodomain APPsbeta were also elevated and paralleled the BACE1 increase in both relative amount and duration. Importantly, cerebral Abeta40 levels in Tg2576 were increased to approximately 200% of control at 7 d after injection, demonstrating that energy inhibition was potentially amyloidogenic. These results support the hypothesis that impaired energy production in the brain may drive AD pathogenesis by elevating BACE1 levels and activity, which, in turn, lead to Abeta overproduction. This process may represent one of the earliest pathogenic events in AD.
Figures
Figure 1.
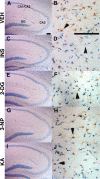
Acute energy inhibition does not cause overt neurodegeneration or astrogliosis. A-J, Two- to 3-month-old Tg2576 mice were given a single intraperitoneal injection of 18 U/kg insulin (INS; C, D), 1 g/kg 2DG (E, F), 100 mg/kg 3NP (G, H), 30 mg/kg KA (I, J), or vehicle (VEH; A, B) and were then allowed to recover for 7 d. Brains were harvested, parasagittal sections were cut, and immunohistochemistry was performed using an anti-GFAP antibody and hematoxylin counterstaining. A, C, E, G, I, Low-magnification images of the hippocampus showing pyramidal cell layers of CA1/2, CA3, and the dentate gyrus (DG). No significant reduction in cell-layer thickness was observed with any of the treatments compared with vehicle control, demonstrating that energy inhibitors did not cause gross neuronal loss or neurodegeneration. B, D, F, H, J, High-magnification images of hippocampal astrocytes near CA3 stained with anti-GFAP antibody. Arrowheads show representative astrocytes. Note that comparable numbers of GFAP-immunopositive astrocytes are present in energy-inhibitor-treated and vehicle control hippocampi, indicating that agents did not induce significant astrogliosis. Scale bars: A, B, 200μm.
Figure 2.
Representative BACE1 immunoblot of brain homogenates from treated Tg2576 mice. Two- to 3-month-old Tg2576 mice were given a single intraperitoneal injection of 18 U/kg insulin, 1 g/kg 2DG, 100 mg/kg 3NP, 30 mg/kg KA, or vehicle and were then allowed to recover for 4 h. Brains were harvested and homogenized, and 15 μg of total protein per lane for each sample was separated on 10% SDS-PAGE and transferred onto PVDF membrane. Blots were then incubated with anti-BACE1 antibody PA1-757 (directed against the C-terminal 17 aa), and signals were detected with ECL+, followed by visualization on a Kodak imager (top panel). Blots were then stripped and reincubated with anti-β-actin antibody (bottom panel). Included on the blot was a BACE1-/- brain homogenate as a negative control (- lane) and a lysate (1 μg) from a human BACE1-overexpressing HEK293 (human embryonic kidney 293) cell line (+ lane). Molecular mass markers are indicated by arrows on the right. Note that the intensities of the BACE1 bands are significantly increased in brain samples from nearly all of the mice treated with energy inhibitors, compared with those that received vehicle only.
Figure 3.
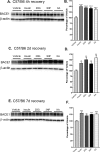
Acute energy inhibition increases BACE1 protein levels in the brains of C57/B6 mice. A-F, Two- to 3-month-old C57/B6 mice were given a single intraperitoneal injection of 18 U/kg insulin, 1 g/kg 2DG, 100 mg/kg 3NP, 30 mg/kg KA, or vehicle and were then allowed to recover for 4 h (A, B), 2 d (C, D) or 7 d (E, F). Brains were then isolated and homogenized, and samples (15μg/lane) were subjected to immunoblot analysis for BACE1 protein using anti-BACE1 antibody PA1-757. Blots were stripped and reprobed with anti-β-actin antibody as a loading control. A, C, E, Representative BACE1 (top panels) and β-actin (bottom panels) immunoblots for the various treatments and recovery times are shown. B, D, F, The intensities of BACE1 band signals were quantified on a PhosphorImager (Eastman Kodak), normalized against the β-actin immunosignals for each sample, and then expressed as percentages of the mean of the vehicle control for a given recovery time. Note that the energy-inhibitor treatments elevated cerebral BACE1 protein levels to ∼125-150% of vehicle control values for all recovery times (*p < 0.05, **p < 0.01, and ***p < 0.001, one-way ANOVA with Newman-Keuls multiple-comparison test). A-D, Data represent mean ± SEM; n = 9 mice/treatment (A, B), n = 5 mice/treatment (C, D), and n = 4 mice/treatment (E, F).
Figure 4.
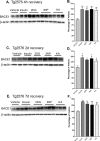
Acute energy inhibition increases BACE1 protein levels in the brains of Tg2576 mice. A-F, Two- to 3-month-old Tg2576 mice were injected with 18 U/kg insulin, 1 g/kg 2DG, 100 mg/kg 3NP, 30 mg/kg KA, or vehicle and were allowed to recover for 4 h (A, B), 2 d (C, D), or 7 d (E, f). A, C, E, Representative immunoblots of brain samples for BACE1 (top panels) and β-actin (bottom panels). B, D, F, BACE1 immunosignals were quantified, normalized against β-actin signals, and expressed as percentages of vehicle controls, as before. Similar to the effects observed in C57/B6 mice, energy-inhibitor treatments in Tg2576 mice caused cerebral BACE1 levels to increase to ∼125-150% of vehicle controls for all recovery times (*p < 0.05 and **p < 0.01, one-way ANOVA with Newman-Keuls multiple-comparison test). Data represent mean ± SEM; n = 6 mice/treatment (A, B), and n = 4 mice/treatment (C-F).
Figure 5.
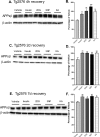
Cerebral levels of APPsβ(sw) are elevated after acute inhibition of energy production in Tg2576 mice. Brain homogenates from Tg2576 mice treated with 18 U/kg insulin, 1 g/kg 2DG, 100 mg/kg 3NP, 30 mg/kg KA, or vehicle were subjected to immunoblot analysis using an antibody raised against the C-terminal neoepitope generated by BACE1 cleavage of APPsw, which recognizes APPsβ(sw) (Seubert et al., 1993; Vassar et al., 1999; Cole et al., 2005). A, C, E, Representative APPsβ(sw) (top panels) andβ-actin (bottom panels) immunoblots of brain samples from treated Tg2576 mice. Recovery times were for 4 h (A, B), 2 d (C, D) or 7 d (E, F). B, D, F, APPsβ(sw) immunosignals were normalized against β-actin signals and expressed as percentages of vehicle controls. Note that cerebral APPsβ(sw) levels were increased to ∼125-175% of vehicle controls after 4 h of recovery from energy inhibition (B), and they continued to be significantly elevated after 2 d (D) and 7 d (F) of recovery (*p < 0.05, **p < 0.01, and ***p < 0,001, one-way ANOVA with Newman-Keuls multiple-comparison test). Data represent mean ± SEM; n = 6 mice/treatment (A, B), and n = 4 mice/treatment (C-F).
Figure 6.
Acute energy inhibition increases cerebral Aβ40 levels in Tg2576 mice. Brain homogenates from Tg2576 mice treated with 18 U/kg insulin, 1 g/kg 2DG, 100 mg/kg 3NP, 30 mg/kg KA, or vehicle were subjected to Aβ40-specific sandwich ELISA. Recovery times were for 4 h (A), 2 d (B), or 7 d (C). Aβ40 levels were expressed as picograms per milligram of total brain protein (determined by BCA assay). Note that brain Aβ40 levels showed a trend toward elevation for several of the treatments after 4 h and 2 d of recovery but did not reach significance. However, by 7 d of recovery, brain Aβ40 levels were increased approximately twofold by all treatments. Data represent mean ± SEM (**p < 0.01 and ***p < 0.001, one-way ANOVA with Newman-Keuls multiple-comparison test; n = 4 per treatment).
Similar articles
- Relationship between ubiquilin-1 and BACE1 in human Alzheimer's disease and APdE9 transgenic mouse brain and cell-based models.
Natunen T, Takalo M, Kemppainen S, Leskelä S, Marttinen M, Kurkinen KMA, Pursiheimo JP, Sarajärvi T, Viswanathan J, Gabbouj S, Solje E, Tahvanainen E, Pirttimäki T, Kurki M, Paananen J, Rauramaa T, Miettinen P, Mäkinen P, Leinonen V, Soininen H, Airenne K, Tanzi RE, Tanila H, Haapasalo A, Hiltunen M. Natunen T, et al. Neurobiol Dis. 2016 Jan;85:187-205. doi: 10.1016/j.nbd.2015.11.005. Epub 2015 Nov 10. Neurobiol Dis. 2016. PMID: 26563932 - Amyloid-β protein (Aβ) Glu11 is the major β-secretase site of β-site amyloid-β precursor protein-cleaving enzyme 1(BACE1), and shifting the cleavage site to Aβ Asp1 contributes to Alzheimer pathogenesis.
Deng Y, Wang Z, Wang R, Zhang X, Zhang S, Wu Y, Staufenbiel M, Cai F, Song W. Deng Y, et al. Eur J Neurosci. 2013 Jun;37(12):1962-9. doi: 10.1111/ejn.12235. Eur J Neurosci. 2013. PMID: 23773065 - The contribution of activated astrocytes to Aβ production: implications for Alzheimer's disease pathogenesis.
Zhao J, O'Connor T, Vassar R. Zhao J, et al. J Neuroinflammation. 2011 Nov 2;8:150. doi: 10.1186/1742-2094-8-150. J Neuroinflammation. 2011. PMID: 22047170 Free PMC article. - BACE1: the beta-secretase enzyme in Alzheimer's disease.
Vassar R. Vassar R. J Mol Neurosci. 2004;23(1-2):105-14. doi: 10.1385/JMN:23:1-2:105. J Mol Neurosci. 2004. PMID: 15126696 Review. - The beta-secretase, BACE: a prime drug target for Alzheimer's disease.
Vassar R. Vassar R. J Mol Neurosci. 2001 Oct;17(2):157-70. doi: 10.1385/JMN:17:2:157. J Mol Neurosci. 2001. PMID: 11816789 Review.
Cited by
- Apolipoprotein e sets the stage: response to injury triggers neuropathology.
Mahley RW, Huang Y. Mahley RW, et al. Neuron. 2012 Dec 6;76(5):871-85. doi: 10.1016/j.neuron.2012.11.020. Neuron. 2012. PMID: 23217737 Free PMC article. Review. - Neuroprotective Effects and Therapeutic Potential of Dichloroacetate: Targeting Metabolic Disorders in Nervous System Diseases.
Zhang Y, Sun M, Zhao H, Wang Z, Shi Y, Dong J, Wang K, Wang X, Li X, Qi H, Zhao X. Zhang Y, et al. Int J Nanomedicine. 2023 Dec 12;18:7559-7581. doi: 10.2147/IJN.S439728. eCollection 2023. Int J Nanomedicine. 2023. PMID: 38106446 Free PMC article. Review. - Vascular risk factors: a ticking time bomb to Alzheimer's disease.
de la Torre JC. de la Torre JC. Am J Alzheimers Dis Other Demen. 2013 Sep;28(6):551-9. doi: 10.1177/1533317513494457. Epub 2013 Jun 28. Am J Alzheimers Dis Other Demen. 2013. PMID: 23813612 Free PMC article. - Alzheimer's Disease: From Mitochondrial Perturbations to Mitochondrial Medicine.
Cardoso S, Carvalho C, Correia SC, Seiça RM, Moreira PI. Cardoso S, et al. Brain Pathol. 2016 Sep;26(5):632-47. doi: 10.1111/bpa.12402. Brain Pathol. 2016. PMID: 27327899 Free PMC article. Review. - Beta-site amyloid precursor protein cleaving enzyme 1 levels become elevated in neurons around amyloid plaques: implications for Alzheimer's disease pathogenesis.
Zhao J, Fu Y, Yasvoina M, Shao P, Hitt B, O'Connor T, Logan S, Maus E, Citron M, Berry R, Binder L, Vassar R. Zhao J, et al. J Neurosci. 2007 Apr 4;27(14):3639-49. doi: 10.1523/JNEUROSCI.4396-06.2007. J Neurosci. 2007. PMID: 17409228 Free PMC article.
References
- Auer RN, Wieloch T, Olsson Y, Siesjo BK (1984) The distribution of hypoglycemic brain damage. Acta Neuropathol (Berl) 64: 177-191. - PubMed
- Barclay L, Zemcov A, Blass JP, McDowell FH (1984) Rapid rate of decline in cerebral blood flow in progressive dementias. Monogr Neural Sci 11: 107-110. - PubMed
- Blasko I, Beer R, Bigl M, Apelt J, Franz G, Rudzki D, Ransmayr G, Kampfl A, Schliebs R (2004) Experimental traumatic brain injury in rats stimulates the expression, production and activity of Alzheimer's disease beta-secretase (BACE-1). J Neural Transm 111: 523-536. - PubMed
- Breteler MM (2000) Vascular risk factors for Alzheimer's disease: an epidemiologic perspective. Neurobiol Aging 21: 153-160. - PubMed
- Brownell AL, Chen YI, Yu M, Wang X, Dedeoglu A, Cicchetti F, Jenkins BG, Beal MF (2004) 3-Nitropropionic acid-induced neurotoxicity—assessed by ultra high resolution positron emission tomography with comparison to magnetic resonance spectroscopy. J Neurochem 89: 1206-1214. - PubMed
Publication types
MeSH terms
Substances
LinkOut - more resources
Full Text Sources
Other Literature Sources
Medical
Miscellaneous


