Golgi inheritance in mammalian cells is mediated through endoplasmic reticulum export activities - PubMed (original) (raw)
Golgi inheritance in mammalian cells is mediated through endoplasmic reticulum export activities
Nihal Altan-Bonnet et al. Mol Biol Cell. 2006 Feb.
Abstract
Golgi inheritance during mammalian cell division occurs through the disassembly, partitioning, and reassembly of Golgi membranes. The mechanisms responsible for these processes are poorly understood. To address these mechanisms, we have examined the identity and dynamics of Golgi proteins within mitotic membranes using live cell imaging and electron microscopy techniques. Mitotic Golgi fragments, seen in prometaphase and telophase, were found to localize adjacent to endoplasmic reticulum (ER) export domains, and resident Golgi transmembrane proteins cycled rapidly into and out of these fragments. Golgi proteins within mitotic Golgi haze-seen during metaphase-were found to redistribute with ER markers into fragments when the ER was fragmented by ionomycin treatment. The temperature-sensitive misfolding mutant ts045VSVG protein, when localized to the Golgi at the start of mitosis, became trapped in the ER at the end of mitosis in cells shifted to 40 degrees C. Finally, reporters for Arf1 and Sar1 activity revealed that Arf1 and Sar1 undergo sequential inactivation during mitotic Golgi breakdown and sequential reactivation upon Golgi reassembly at the end of mitosis. Together, these findings support a model of mitotic Golgi inheritance that involves inhibition and subsequent reactivation of cellular activities controlling the cycling of Golgi components into and out of the ER.
Figures
Figure 1.
Golgi proteins distribute between Golgi and non-Golgi membranes in interphase and rapidly cycle in and out of mitotic fragments during prometaphase. (A) NRK cells transiently expressing GalT-CFP were fixed and immunostained with a primary antibody against GFP and a Cy5-tagged secondary antibody. Left, distribution of CFP fluorescence. Right, Cy5 fluorescence in the same cell. Note the two labeling patterns are identical. (B) Golgi-associated and non-Golgi-associated fluorescence were quantified in individual cells by measuring the mean fluorescence per pixel within each region, subtracting background noise and multiplying by the total area of each region. The plot shows the relative sizes of the two pools for cells transiently expressing GalT-CFP (n = 10; black bars), cells immunostained with antibodies to CFP- and Cy5-labeled secondary antibodies (n = 20; red bars), cells stably expressing GalT-CFP (n = 10; blue bars), and cells that were fixed and immunostained with antibodies against native mannosidase II (n = 20; green bars). (C) Time-lapse images of a single NRK cell transiently expressing GalT-YFP progressing through mitosis. (D) The prebleach image shows an NRK cell transiently expressing GalT-YFP entering mitosis. The entire cell was photobleached in the outlined red area, and cell fluorescence was monitored. Postbleach images at representative stages of mitosis are shown. Fluorescence was monitored with a wide pinhole setting (14 Airy units with a 40×/1.3 N.A. objective) to collect fluorescence from the entire depth of the cell over the course of mitosis. Note no significant fluorescence reappeared as the cell progressed through to cytokinesis, suggesting that newly synthesized GalT-YFP and newly folded YFP did not contribute significant fluorescence to the cells during mitosis. (E) The prebleach image shows an NRK cell expressing GalT-YFP in prometaphase (top) or after treatment with nocodazole for 2 h (bottom). A region of interest containing Golgi fragments (outlined in white) was photobleached. Postbleach images collected at representative time points with a wide pinhole confocal setting (40×/1.3 N.A.; ∼14 Airy units) are shown. The insets show the photobleached region of interest at high magnification. (F) Fluorescent intensity of an individual prometaphase fragment (top) or nocodazole fragment (bottom) was measured at 15-s time intervals in a similar experiment as in G and plotted as a percentage of initial prebleach fluorescence in the fragment (after subtraction of background fluorescence). Recovery of fluorescence into the bleached prometaphase fragment occurred more rapidly than into the bleached nocodazole fragment. Bars, 5 μm.
Figure 2.
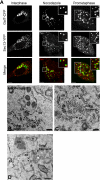
Prometaphase Golgi fragments localize near ER exit sites. (A) NRK cells stably expressing Sec13-YFP were cotransfected with GalT-CFP and the distribution of the two markers was then imaged using a narrow pinhole confocal setting. Shown are images of a cell in interphase (left), a cell treated with nocodazole (middle), and a cell in prometaphase (right). Note the localization of prometaphase and nocodazole Golgi fragments (labeled with GalT-CFP) near to ER exit sites (labeled with Sec13-YFP). The area in the white box is enlarged in the inset. Bar, 5 μm. (B) NRK cells expressing HRP-mannosidase II in prometaphase were fixed, processed for immunoperoxidase labeling, and prepared for electron microscopy. Images of mitotic Golgi fragments in these cells revealed HRP labeling of vesiculotubular clusters in proximity to ER, with no HRP-positive structures (i.e., vesicles) observed in areas outside the vesiculoubular clusters. (C) NRK cells in prometaphase were fixed and examined by electron microscopy without HRP labeling. Mitotic vesiculoubular clusters adjacent to ER tubules (arrows) are shown. (D) Image of prometaphase cell prepared as in C showing vesiculotubular clusters and their intimate association with ER (arrows). Ch, chromosome; m, mitochondria. Bar, 0.5 μm in electron micrographs.
Figure 3.
Arf1 and Sec13 sequentially redistribute into the cytosol as cells progress from prophase to metaphase. (A) NRK cells expressing Arf1-CFP and Sec13-YFP were imaged as they progressed from interphase through mitosis. A wide-open pinhole confocal setting (14 Airy units with a 40×/1.3 N.A. objective) was used to collect fluorescence from the entire cell depth. Selected images during interphase, prophase, prometaphase, and metaphase are shown. Note that at prometaphase very little Arf1-CFP was associated with subcellular structures, whereas a large fraction of Sec13-YFP was associated with ER exit sites. This indicated that during mitosis Arf1-CFP redistributed into the cytosol sooner than Sec13-YFP. Bars, 5 μm. (B) Time-lapse images of individual NRK cells coexpressing Arf1-CFP and GalT-YFP (GalT-YFP was used to identify the Golgi membrane) (n = 10 cells) or expressing Sec13-YFP alone (n = 20) were collected as the cells progressed through mitosis. The fluorescence from Arf1-CFP (black bars) and Sec13-YFP (gray bars) at different stages of mitosis were quantified (described in Materials and Methods) and plotted in a histogram. The data showed that Arf1-CFP was lost from Golgi membranes before ER export domains labeled with Sec13-YFP disappeared.
Figure 4.
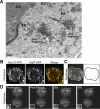
Characterization of mitotic Golgi fragments seen in telophase. (A) Electron microscopy of mitotic Golgi fragments observed during telophase. Note the proximity of mitotic vesiculotubular clusters to ER. Ch, chromosome. Bar, 0.2 μm. (B) Mitotic NRK cells coexpressing GalT-CFP and Sec13-YFP were imaged during telophase using a narrow pinhole confocal setting. The area in the white box is enlarged in the inset. Note the coalignment of telophase Golgi fragments labeled with GalT-CFP and ER export domains labeled with Sec13-YFP. Bar, 5 μm. (C) An NRK cell expressing GalT-CFP in telophase was imaged every 1.2 s over 3 min using a wide pinhole confocal setting, and the images were merged into a single file (left). The trajectories of five fragments (outlined in white) were analyzed using particle track algorithm of NIH Image software and are plotted in black (right). Bar, 5 μm. (D) A region of interest containing a fragment (outlined in white) was selectively photobleached in a telophase cell expressing GalT-YFP. Images were collected every 20 s with a wide pinhole confocal settings. Note the rapid recovery of fluorescence (within 80 s) into the photobleached region of interest. Bar, 5 μm.
Figure 5.
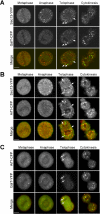
Dynamics of GalT-CFP, Sec13-YFP, and Arf1-CFP during exit from mitosis. (A) A single NRK cell stably expressing Sec13-YFP and cotransfected with GalT-CFP progressing through mitosis was imaged with a wide pinhole confocal setting. Representative images of the cell in metaphase, anaphase, telophase, and cytokinesis are shown. Arrows point to the telophase fragments containing both Sec13-YFP and GalT-CFP labeling. Note that Sec13-YFP labeling preceded GalT-CFP labeling of the fragments (Supplemental Figure S5 movie). (B) Representative confocal images of metaphase, anaphase, telophase, and cytokinesis from a single NRK cell stably expressing Sec13-YFP and cotransfected with Arf1-CFP progressing through mitosis are shown. Arrows point to telophase fragments containing both Sec13-YFP and Arf1-CFP. Note that Sec13-YFP reassociated with the punctate fragments before Arf1-CFP. (C) Representative confocal images of metaphase, anaphase, telophase, and cytokinesis from a single NRK cell cotransfected with Arf1-CFP and GalT-YFP progressing through mitosis are shown. Arrows point to telophase fragments containing both Arf1-CFP and GalT-YFP. Note that both Arf1-CFP and GalT-YFP reassociated with fragments only during telophase. Bars, 5 μm.
Figure 6.
Distributions of Golgi enzymes and ER markers during mitosis. (A) Diagram of bleaching protocol in which the area surrounding the Golgi is selectively photobleached to remove all non-Golgi fluorescence in the cell. The non-Golgi area was photobleached rapidly (∼15 s) with a high-intensity laser beam. (B) A single NRK cell transiently expressing GalT-YFP imaged in interphase and metaphase after the photobleaching protocol described in A. The images were obtained using either a wide pinhole (∼8 Airy units with 63×/1.4 N.A. objective) (top) or narrow pinhole (1.2 Airy units with 63×/1.4 N.A. objective) (bottom). The area in the white box is enlarged to show the gain in resolution of subcellular structures when the pinhole is narrowed. (C) GalT-CFP and ss-RFP-KDEL distributions in an NRK cell undergoing mitosis. Images were obtained using a narrow pinhole (1.2 Airy units with 63×/1.4 N.A. objective). (D) Nonsynchronized HeLa cells were fixed and immunostained with antibodies against native Sec61β and galactosyltransferase. Interphase and metaphase stage cells were selected and imaged on a confocal microscope with a narrow pinhole (1.2 Airy units with 63×/1.4 N.A. objective). Representative images from 10 cells each of interphase and metaphase stage are shown. Bars, 5 μm.
Figure 7.
Golgi and ER markers codistribute when the ER is fragmented with ionomycin. (A) HeLa cells coexpressing GalT-CFP and ss-RFP-KDEL entering mitosis were identified and the non-Golgi pool of GalT-CFP fluorescence was photobleached (as shown in Figure 6A). Once the cells had entered late prometaphase/metaphase, they were incubated with or without 10 μg/ml ionomycin for ∼10 min. The distribution of GalT-CFP and ss-RFP-KDEL was then imaged using a narrow pinhole confocal setting (1.2 Airy units with 63×/1.4 N.A. objective). The area in the white box is enlarged to show the coalignment of fragments containing GalT-CFP and ss-RFP-KDEL. Arrowheads point to mitotic fragments that contain GalT-CFP but not ss-RFP-KDEL (which are seen in both treated and untreated cells). (B) Cells coexpressing GalT-YFP and ss-RFP-KDEL were treated with or without ionomycin as described above. A region of interest was photobleached (see diagram), and recovery into the photobleached area was monitored over time with a wide pinhole confocal setting (∼14 Airy units with 40×/1.3 N.A. objective). The recovery rates are plotted.
Figure 8.
Retrieval of ts045VSVG-YFP to the ER during mitosis. (A) Scheme of experiment. (B and C) NRK cells cotransfected with ts045VSVG-YFP and GalT-CFP were synchronized with aphidicolin (Altan-Bonnet et al., 2003) and grown overnight at 40°C. Then, 7.5 h after aphidicolin washout, before entry into mitosis, cells were transferred to 32°C for 10-15 min to redistribute ts045VSVG-YFP into the Golgi. The fluorescence of ts045VSVG-YFP and GalT-CFP outside the Golgi region of interest was then photobleached in early prophase cells (B and C, postbleach). The cells were then incubated either at 32°C (C) or at 40°C and imaged while going through mitosis (B). Images at representative time points postbleach are shown. At the end of mitosis (corresponding to times after the 35-min time point), the cells at 40°C were shifted back to 32°C. Arrows at the 50-min time point in B and C point to the pool of ts045VSVG-YFP at the plasma membrane. All images were collected with a 40×/1.3 N.A. objective and wide pinhole confocal settings (∼14 Airy units) to collect fluorescence from entire depth of the cell. Bars, 5 μm.
Figure 9.
ER-dependent model for Golgi breakdown and reassembly in mitosis. During interphase, Golgi enzymes (green dots) undergo constitutive cycling through the Golgi apparatus, ER, and ER export domains as part of a general mechanism for maintaining the identity of Golgi membranes (Altan-Bonnet et al., 2004). At steady state, roughly 80% of Golgi enzymes reside in the Golgi and 20% in the ER or ER export domains. Between prophase and prometaphase, Golgi enzymes undergo enhanced retrograde transport back to the ER because of reduced Arf1 activity on membranes. Because cytoplasmic microtubules are depolymerized at this stage of mitosis, the Golgi enzymes cannot return to a centrosomal location and instead accumulate in membrane adjacent to ER export domains (cycling in and out of these domains). During metaphase, both Sar1 and Arf1 become largely inactivated. This causes ER export domains to disappear and Golgi enzymes to relocate to the ER. By telophase, Sar1 is reactivated and ER export domains are reformed. Once Arf1 is reactivated as well, Golgi enzymes are exported from the ER to ER export domains (cycling in and out of them). By cytokinesis, both Sar1 and Arf1 are fully active and cytoplasmic microtubules have repolymerized. ER export domains can now differentiate into pre-Golgi structures that bud off the ER and track along microtubules into the perinuclear region where they fuse into a Golgi stack. Golgi enzymes now undergo normal constitutive cycling between Golgi, ER, and ER export domains.
Similar articles
- An ordered inheritance strategy for the Golgi apparatus: visualization of mitotic disassembly reveals a role for the mitotic spindle.
Shima DT, Cabrera-Poch N, Pepperkok R, Warren G. Shima DT, et al. J Cell Biol. 1998 May 18;141(4):955-66. doi: 10.1083/jcb.141.4.955. J Cell Biol. 1998. PMID: 9585414 Free PMC article. - In tobacco leaf epidermal cells, the integrity of protein export from the endoplasmic reticulum and of ER export sites depends on active COPI machinery.
Stefano G, Renna L, Chatre L, Hanton SL, Moreau P, Hawes C, Brandizzi F. Stefano G, et al. Plant J. 2006 Apr;46(1):95-110. doi: 10.1111/j.1365-313X.2006.02675.x. Plant J. 2006. PMID: 16553898 - Golgi membranes are absorbed into and reemerge from the ER during mitosis.
Zaal KJ, Smith CL, Polishchuk RS, Altan N, Cole NB, Ellenberg J, Hirschberg K, Presley JF, Roberts TH, Siggia E, Phair RD, Lippincott-Schwartz J. Zaal KJ, et al. Cell. 1999 Dec 10;99(6):589-601. doi: 10.1016/s0092-8674(00)81548-2. Cell. 1999. PMID: 10612395 - Golgi apparatus partitioning during cell division.
Rabouille C, Jokitalo E. Rabouille C, et al. Mol Membr Biol. 2003 Apr-Jun;20(2):117-27. doi: 10.1080/0968768031000084163. Mol Membr Biol. 2003. PMID: 12851069 Review. - ARF1 and SAR1 GTPases in endomembrane trafficking in plants.
Cevher-Keskin B. Cevher-Keskin B. Int J Mol Sci. 2013 Sep 5;14(9):18181-99. doi: 10.3390/ijms140918181. Int J Mol Sci. 2013. PMID: 24013371 Free PMC article. Review.
Cited by
- Regulation of endoplasmic reticulum turnover by selective autophagy.
Khaminets A, Heinrich T, Mari M, Grumati P, Huebner AK, Akutsu M, Liebmann L, Stolz A, Nietzsche S, Koch N, Mauthe M, Katona I, Qualmann B, Weis J, Reggiori F, Kurth I, Hübner CA, Dikic I. Khaminets A, et al. Nature. 2015 Jun 18;522(7556):354-8. doi: 10.1038/nature14498. Epub 2015 Jun 3. Nature. 2015. PMID: 26040720 - Rhomboid intramembrane protease RHBDL4 triggers ER-export and non-canonical secretion of membrane-anchored TGFα.
Wunderle L, Knopf JD, Kühnle N, Morlé A, Hehn B, Adrain C, Strisovsky K, Freeman M, Lemberg MK. Wunderle L, et al. Sci Rep. 2016 Jun 6;6:27342. doi: 10.1038/srep27342. Sci Rep. 2016. PMID: 27264103 Free PMC article. - Cisternal organization of the endoplasmic reticulum during mitosis.
Lu L, Ladinsky MS, Kirchhausen T. Lu L, et al. Mol Biol Cell. 2009 Aug;20(15):3471-80. doi: 10.1091/mbc.e09-04-0327. Epub 2009 Jun 3. Mol Biol Cell. 2009. PMID: 19494040 Free PMC article. - The ER tether VAPA is required for proper cell motility and anchors ER-PM contact sites to focal adhesions.
Siegfried H, Farkouh G, Le Borgne R, Pioche-Durieu C, De Azevedo Laplace T, Verraes A, Daunas L, Verbavatz JM, Heuzé ML. Siegfried H, et al. Elife. 2024 Mar 6;13:e85962. doi: 10.7554/eLife.85962. Elife. 2024. PMID: 38446032 Free PMC article. - Live-cell assays to identify regulators of ER-to-Golgi trafficking.
Lisauskas T, Matula P, Claas C, Reusing S, Wiemann S, Erfle H, Lehmann L, Fischer P, Eils R, Rohr K, Storrie B, Starkuviene V. Lisauskas T, et al. Traffic. 2012 Mar;13(3):416-32. doi: 10.1111/j.1600-0854.2011.01318.x. Epub 2012 Jan 3. Traffic. 2012. PMID: 22132776 Free PMC article.
References
- Acharya, U., Mallabiabarrena, A., Acharya, J. K., and Malhotra, V. (1998). Signaling via mitogen-activated protein kinase kinase (MEK1) is required for Golgi fragmentation during mitosis. Cell 92, 183-192. - PubMed
- Altan-Bonnet, N., Sougrat, R., and Lippincott-Schwartz, J. (2004). Molecular basis for Golgi maintenance and biogenesis. Curr. Opin. Cell Biol. 16, 364-372. - PubMed
- Barlowe, C., Orci, L., Yeung, T., Hosobuchi, M., Hamamoto, S., Salama, N., Rexach, M. F., Ravazzola, M., Amherdt, M., and Schekman, R. (1994). COPII: a membrane coat formed by Sec proteins that drive vesicle budding from the endoplasmic reticulum. Cell 77, 895-907 - PubMed
Publication types
MeSH terms
Substances
LinkOut - more resources
Full Text Sources
Miscellaneous


