Inactivation of NF1 in CNS causes increased glial progenitor proliferation and optic glioma formation - PubMed (original) (raw)
Inactivation of NF1 in CNS causes increased glial progenitor proliferation and optic glioma formation
Yuan Zhu et al. Development. 2005 Dec.
Abstract
The gene responsible for neurofibromatosis type 1 (NF1) encodes a tumor suppressor that functions as a negative regulator of the Ras proto-oncogene. Individuals with germline mutations in NF1 are predisposed to the development of benign and malignant tumors of the peripheral and central nervous system (CNS). Children with this disease suffer a high incidence of optic gliomas, a benign but potentially debilitating tumor of the optic nerve; and an increased incidence of malignant astrocytoma, reactive astrogliosis and intellectual deficits. In the present study, we have sought insight into the molecular and cellular basis of NF1-associated CNS pathologies. We show that mice genetically engineered to lack NF1 in CNS exhibit a variety of defects in glial cells. Primary among these is a developmental defect resulting in global reactive astrogliosis in the adult brain and increased proliferation of glial progenitor cells leading to enlarged optic nerves. As a consequence, all of the mutant optic nerves develop hyperplastic lesions, some of which progress to optic pathway gliomas. These data point to hyperproliferative glial progenitors as the source of the optic tumors and provide a genetic model for NF1-associated astrogliosis and optic glioma.
Figures
Fig. 1
Comparison of the number of BrdU-positive cells in adult and developing control and mutant brains. (A) The number of BrdU-positive cells in the cerebral cortex (Ctx), thalamus (Th) and cerebellum (Cb) of adult mutant brains (_n_=6) was not significantly different from those in adult control brains (_n_=6). The data plotted are mean±s.e.m. Cerebral cortex, _P_=0.42; thalamus, _P_=0.46; cerebellum, _P_=0.57. (B) The number of BrdU-positive cells in developing mutant brains (_n_=5) was significantly increased relative to those in controls (_n_=3). Cerebral cortex, _P_=0.001; thalamus, _P_=0.007. **P<0.01. (C) Sections from the P8 control cerebral cortex (a,c) and thalamus (e,g), and the P8 mutant cortex (b,d) and thalamus (f,h) were stained with an anti-BrdU antibody. In contrast to the control P8 brains, which have low proliferation, the mutant brains contain significantly more BrdU-positive cells. Scale bars: 100 μm.
Fig. 2
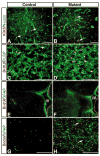
Proliferating cells in P8 control and mutant brains express progenitor cell markers, not a mature astrocyte marker. Sections from P8 control and Nf1hGFAPKO mutant brains were subjected to double-labeling immunofluorescence with anti-Ki67 (red) and anti-nestin (green) (A,B), with anti-BrdU (red) and anti-BLBP (green) (C,D), and with anti-BrdU (red) and anti-GFAP (green) (E,F). BrdU staining in the external granule cells in the P8 cerebella serves an internal positive control for this study (E,F). (G,H) Higher magnification of sections in E,F, showing that only a small number of BrdU-positive cells in the mutant brain but not in the control brain expressed GFAP (arrows in H). (A–D) Sections from the thalamus. (E–F) Sections from the brainstem. IV, the fourth ventricle. Scale bars: 100 μm.
Fig. 3
hGFAP-cre is expressed in glial progenitor cells during postnatal development. (A) Sections from the thalamus of P8 control (a,c,e) and mutant (CKO) brains (b,d,f) were subjected to double-labeling immunofluorescence with anti-Cre (red) and anti-GFAP (green) (a–d), and anti-Cre (red) and anti-BLBP (green) (e,f). (B) Sections from the cerebellar white matter of P8 control (a,c,e) and mutant brains (b,d,f) were subjected to double-labeling immunofluorescence with anti-Cre/anti-GFAP (a–d) and anti-Cre/anti-BLBP (e,f). The mutant cerebellar white matter has significantly more GFAP-positive cells than control (marked by broken lines in a–d). Most of the Cre-positive/GFAP-negative glial progenitor cells are distributed in the periphery of the cerebellar white matter (outside the broken lines). Arrows indicate glial progenitor cells expressing Cre and BLBP, but not GFAP. Genotypes: control mice, Nf1flox/+;_hGFAP_-cre+; mutant mice, Nf1flox/−;_hGFAP_-cre+ or Nf1flox/flox;_hGFAP_-cre+. Scale bars: 100 μm.
Fig. 4
_Nf1_−/− glial progenitor cells undergo astrocytic differentiation. (A) Sections from P8 control (a,c,e) and Nf1hGFAPKO mutant (b,d,f) brains were subjected to double-labeling immunofluorescence with anti-Cre (red) and anti-GFAP (green). (a,b) Sections from the control and mutant cerebral cortex (CC); (c–f) low (c,d) and high (e,f) magnification of sections from control and mutant hippocampal dentate gyrus (DG). Most of the GFAP-positive cells also express the Cre transgene. (B) Sections from P8 control (a,c,e) and Nf1hGFAPKO mutant (b,d,f) brains were subjected to double-labeling immunofluorescence with anti-nestin (red) and anti-GFAP (green). (a,b) Sections from the corpus callosum; (c,d) sections from the brainstem; (e,f) sections from the dentate gyrus. Most of the GFAP-positive astrocytes in both control and mutant P8 brains do not express nestin, except in the dentate gyrus (arrows in e,f), where a small number of cells express both GFAP and nestin. There are low levels of nestin expression in the endothelial cells. Genotypes: control mice, Nf1flox/+;_hGFAP_-cre+; mutant mice, Nf1flox/−;_hGFAP_-cre+ or Nf1flox/flox;_hGFAP_-cre+. Scale bars: 100 μm.
Fig. 5
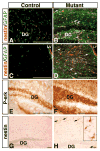
A subset of _Nf1_−/− astrocytes in the adult brain express nestin. Sections from adult control (A) and mutant (B) dentate gyrus (DG), as well as control (C) and mutant (D) cerebral cortex were subjected to double-labeling fluorescence with anti-nestin (red) and anti-GFAP (green). LV, lateral ventricle. Reactive astrocytes expressing both GFAP and nestin were observed only in the mutant brain (arrows in B,D). Immunohistochemical analysis with anti-P-erk of the control (E) and mutant (F) dentate gyrus. A population of nestin-positive reactive astrocytes (arrows in H, see inset for high magnification) was identified only in a subset of aged mutant brains, but not in control or mutant mice at young age (G). Scale bars: 100 μm.
Fig. 6
Cre-mediated recombination leads to enlarged optic nerves. X-gal staining of the proximal optic nerve immediately adjacent to the retina (A) and distal optic nerve near the chiasm (asterisk) (B). Optic nerves were dissected from 2-month-old mice with the genotype of _hGFAP_-cre+; Rosa26-lacZ/+ (_n_=3). (C,D) Adjacent sections to A,B were subjected to double-labeling immunofluorescence with anti-lacZ (red) and anti-GFAP (green). Most of the _lacZ_-positive cells are GFAP-expressing astrocytes. (E) _hGFAP-cre_-mediated recombination in the optic nerve was revealed by PCR analysis. Upper panel: a PCR assay identifying the floxed NF1 allele (×1) and recombined floxed allele (Δ) indicated that a significant number of the floxed NF1 alleles in the optic nerve (ON), cerebral cortex (Ctx) and hippocampus (Hp) of the Nf1flox/+;_hGFAP_-cre+ mice transformed into the recombined alleles. Bottom panel: a PCR assay that identifies the wild type (+) and the floxed (×1) NF1 allele confirmed the genotype of the tissues analyzed. (F) A representative of control (left) and mutant (right) eyes with the optic nerves and chiasm (arrowheads). High-magnification of view of control (G) and mutant (H) optic nerves with chiasms (asterisk). The mutant nerve has a conspicuous enlargement (indicated by broken lines and arrowheads). Scale bars: 100 μm in A–D; 1 mm in F–H.
Fig. 7
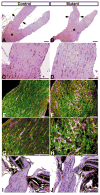
Nf1hGFAPKO optic nerves are hyperplastic. Sections from control (A,C) and mutant (B,D) distal optic nerves and chiasms (asterisk) were stained with Hematoxylin and Eosin. Arrows in A,B indicate the enlarged area of the nerves shown in C,D, respectively. Adjacent sections from control (E,G) and mutant (F,H) optic nerves were stained with anti-nestin (red) and anti-GFAP (green). Mutant optic nerves are enlarged (B), hyperplastic (D) and disorganized (F,H). Sections from control (I) and mutant (J) proximal optic nerves were stained with Hematoxylin and Eosin. The most pronounced hypercellularity was observed in the proximal optic nerves (J). Scale bars: 100 μm.
Fig. 8
Nf1hGFAPKO mice develop optic pathway gliomas. Two independent optic gliomas (B,C) are shown with Hematoxylin and Eosin staining and compared with the control (A). Adjacent sections from control (D) and mutant nerves with gliomas (E,F) were stained with anti-nestin (red) and anti-GFAP (green). Unlike the well-organized normal astrocytes that express both nestin and GFAP in control (D), most of the cells in optic gliomas express only GFAP (E,F, arrowheads). Scale bars: 100 μm.
Fig. 9
Nf1hGFAPKO hyperplastic nerves have increased proliferation and express glial progenitor cell markers. (A) The quantification of BrdU-positive cells in the adult control (CTR) and mutant (CKO) distal (DN) and proximal (PN) nerves. The data plotted are mean±s.e.m. (distal nerve, CTR, _n_=4, CKO, _n_=5, **P<0.001; proximal nerve, CTR, _n_=3, CKO, _n_=6, **P<0.001). Sections from control (B,D) and mutant (C,E) distal (B,C) and proximal (D,E) optic nerves were stained with anti-BrdU (red) and anti-GFAP (green). Sections from control (F) and mutant (G) nerves were stained with anti-Ki67 (red) and anti-nestin (green). Arrows in B and C indicate proliferating cells that do not express GFAP. Arrows in F and G indicate nestin-positive proliferating cells (inset in G provides higher magnification). Sections from control proximal (H,J), mutant proximal (I,K), control distal (L) and mutant distal (M) optic nerves were stained with anti-BLBP. Arrow in J indicates a BLBP-positive cells with normal nuclei in the normal nerve; arrows in K,M indicate BLBP-positive cells with atypical nuclei in the mutant nerve. Sections from control (N) and mutant (O) optic nerves were stained with anti-Pax2. Scale bars: 100 μm.
Fig. 10
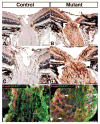
Glial cells in mutant optic nerves have elevated levels of activated MAPK. Sections of the proximal optic nerves from control mice (A,C) and mutant mice (B,D) were stained with anti-P-erk. The arrow in D indicates the tumor cells with activated MAPK. Sections from control (E) and mutant (F) optic nerves were subjected to triple labeling with anti-P-erk (red), anti-GFAP (green) and DAPI (blue). DAPI was used to label the nuclei. In contrast to the control nerves where little or no cells had activated MAPK (E), mutant nerves contained numerous P-erk positive cells, some of which co-expressed GFAP (F, arrows) and some of which failed to express GFAP (F, arrowheads). Scale bars: 100 μm.
Similar articles
- NG2-cells are not the cell of origin for murine neurofibromatosis-1 (Nf1) optic glioma.
Solga AC, Gianino SM, Gutmann DH. Solga AC, et al. Oncogene. 2014 Jan 16;33(3):289-99. doi: 10.1038/onc.2012.580. Epub 2013 Jan 14. Oncogene. 2014. PMID: 23318450 Free PMC article. - NF1 germline mutation differentially dictates optic glioma formation and growth in neurofibromatosis-1.
Toonen JA, Anastasaki C, Smithson LJ, Gianino SM, Li K, Kesterson RA, Gutmann DH. Toonen JA, et al. Hum Mol Genet. 2016 May 1;25(9):1703-13. doi: 10.1093/hmg/ddw039. Epub 2016 Feb 16. Hum Mol Genet. 2016. PMID: 26908603 Free PMC article. - The cell of origin dictates the temporal course of neurofibromatosis-1 (Nf1) low-grade glioma formation.
Solga AC, Toonen JA, Pan Y, Cimino PJ, Ma Y, Castillon GA, Gianino SM, Ellisman MH, Lee DY, Gutmann DH. Solga AC, et al. Oncotarget. 2017 Jul 18;8(29):47206-47215. doi: 10.18632/oncotarget.17589. Oncotarget. 2017. PMID: 28525381 Free PMC article. - Insights into optic pathway glioma vision loss from mouse models of neurofibromatosis type 1.
Freret ME, Gutmann DH. Freret ME, et al. J Neurosci Res. 2019 Jan;97(1):45-56. doi: 10.1002/jnr.24250. Epub 2018 Apr 28. J Neurosci Res. 2019. PMID: 29704429 Free PMC article. Review. - Neurofibromatosis 1.
Lynch TM, Gutmann DH. Lynch TM, et al. Neurol Clin. 2002 Aug;20(3):841-65. doi: 10.1016/s0733-8619(01)00019-6. Neurol Clin. 2002. PMID: 12432832 Review.
Cited by
- A RASopathy gene commonly mutated in cancer: the neurofibromatosis type 1 tumour suppressor.
Ratner N, Miller SJ. Ratner N, et al. Nat Rev Cancer. 2015 May;15(5):290-301. doi: 10.1038/nrc3911. Epub 2015 Apr 16. Nat Rev Cancer. 2015. PMID: 25877329 Free PMC article. Review. - Skin-derived precursor cells as an in vitro modelling tool for the study of type 1 neurofibromatosis.
Gutiérrez-Rivera A, Iribar H, Tuneu A, Izeta A. Gutiérrez-Rivera A, et al. Stem Cells Int. 2012;2012:646725. doi: 10.1155/2012/646725. Epub 2012 Apr 1. Stem Cells Int. 2012. PMID: 22550514 Free PMC article. - Schweinfurthin A selectively inhibits proliferation and Rho signaling in glioma and neurofibromatosis type 1 tumor cells in a NF1-GRD-dependent manner.
Turbyville TJ, Gürsel DB, Tuskan RG, Walrath JC, Lipschultz CA, Lockett SJ, Wiemer DF, Beutler JA, Reilly KM. Turbyville TJ, et al. Mol Cancer Ther. 2010 May;9(5):1234-43. doi: 10.1158/1535-7163.MCT-09-0834. Epub 2010 May 4. Mol Cancer Ther. 2010. PMID: 20442305 Free PMC article. - Generation of a Mouse Model to Study the Noonan Syndrome Gene Lztr1 in the Telencephalon.
Talley MJ, Nardini D, Shabbir N, Ehrman LA, Prada CE, Waclaw RR. Talley MJ, et al. Front Cell Dev Biol. 2021 Jun 16;9:673995. doi: 10.3389/fcell.2021.673995. eCollection 2021. Front Cell Dev Biol. 2021. PMID: 34222248 Free PMC article. - An Overview of Optic Pathway Glioma With Neurofibromatosis Type 1: Pathogenesis, Risk Factors, and Therapeutic Strategies.
Chen Y, Yu J, Ge S, Jia R, Song X, Wang Y, Fan X. Chen Y, et al. Invest Ophthalmol Vis Sci. 2024 Jun 3;65(6):8. doi: 10.1167/iovs.65.6.8. Invest Ophthalmol Vis Sci. 2024. PMID: 38837168 Free PMC article. Review.
References
- Alvarez-Buylla A, Garcia-Verdugo JM, Tramontin AD. A unified hypothesis on the lineage of neural stem cells. Nat Rev Neurosci. 2001;2:287–293. - PubMed
- Anthony TE, Klein C, Fishell G, Heintz N. Radial glia serve as neuronal progenitors in all regions of the central nervous system. Neuron. 2004;41:881–890. - PubMed
- Bajenaru ML, Hernandez MR, Perry A, Zhu Y, Parada LF, Garbow JR, Gutmann DH. Optic nerve glioma in mice requires astrocyte Nf1 gene inactivation and Nf1 brain heterozygosity. Cancer Res. 2003;63:8573–8577. - PubMed
- Ballester R, Marchuk D, Boguski M, Saulino A, Letcher R, Wigler M, Collins F. The NF1 locus encodes a protein functionally related to mammalian GAP and yeast IRA proteins. Cell. 1990;63:851–859. - PubMed
Publication types
MeSH terms
Substances
LinkOut - more resources
Full Text Sources
Medical
Molecular Biology Databases
Research Materials
Miscellaneous


