The effect of osmolytes and small molecule on Quadruplex-WC duplex equilibrium: a fluorescence resonance energy transfer study - PubMed (original) (raw)
The effect of osmolytes and small molecule on Quadruplex-WC duplex equilibrium: a fluorescence resonance energy transfer study
Niti Kumar et al. Nucleic Acids Res. 2005.
Abstract
The structural competition between the G-quadruplex and Watson-Crick duplex has been implicated for the repetitive DNA sequences, but the factors influencing this competitive equilibrium in the natural and pharmacological context need to be elucidated. Using a 21mer 5'-Fluorescein-d[(G3TTA)3G3]-TAMRA-3' as a model system, extensive fluorescence resonance energy transfer analysis was carried out to investigate sensitivity of this equilibrium to osmotic stress and quadruplex selective small molecule. The binding affinities and kinetics involved in the hybridization of quadruplex to its complementary strand in the absence and presence of different concentrations of osmolytes (ethylene glycol and glycerol) and a quadruplex selective ligand (cationic porphyrin-TMPyP4) were determined. The presence of osmolytes and cationic porphyrin decreased the binding affinity of quadruplex to its complementary strand and slowed the kinetics of the reaction by delaying the hybridization process. Our binding data analysis indicates that the presence of either osmolytes or porphyrin increase the amount of quadruplex in the equilibrium. In 100 mM KCl solution, when 30 nM of each of the components, i.e. quadruplex and the complementary strand, were mixed together, the amount of quadruplex present in the system under equilibrium were 17.6, 23.4, 23.1 and 19.6 nM in the absence and presence of 10% ethylene glycol, 10% glycerol and 150 nM TMPyP4, respectively. Fluorescence melting profile of quadruplex in the absence and presence of these perturbants confirm the findings that osmolytes and cationic porphyrin stabilize quadruplex, and thus, shift the equilibrium to quadruplex formation.
Figures
Figure 1
Fluorescence emission spectra of the dual labeled d[(G3TTA)3G3] (12 nM) at 10°C in 50 mM MES buffer, pH 7 at different KCl concentration. Arrow headed line indicates the KCl increment direction. Inset shows fluorescence emission intensity at 520 nm (Δ_F_ as described in the text) of the dual labeled d[(G3TTA)3G3] versus KCl concentration.
Figure 2
Fluorescence emission spectra of the dual labeled d[(G3TTA)3G3] (30 nM) in 50 mM MES buffer with 100 mM KCl, pH7 at different temperatures. Arrow headed line indicates the temperature increment direction from 20 to 90°C. Inset shows intensity at 520 nm versus temperature plot.
Figure 3
Fluorescence emission spectra of the dual labeled quadruplex-K+ complex (12 nM) in 50 mM MES buffer with 100 mM KCl, pH7 at different complementary strand concentration. Arrow headed line indicates complementary strand concentration increment. Inset shows the plots of relative fluorescence emission intensity at 520 nm (Δ_F_ as described in the text) versus complementary strand concentration in KCl buffer at 20°C.
Figure 4
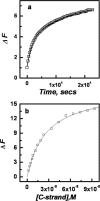
(a) Opening up of the quadruplex-K+ (30 nM) at 20°C upon addition of equimolar concentration of C-strand measured in 50 mM MES buffer, pH 7 containing 100 mM KCl; (b) Plots of relative fluorescence emission intensity (Δ_F_ as described in the text) of quadruplex-K+ (12 nM) at 520 nm measured using FLUOstar OPTIMA plate reader versus complementary strand concentration in KCl buffer, pH 7 at 20°C.
Figure 5
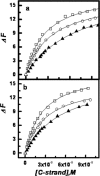
(a) Plots of relative fluorescence emission intensity of Quadruplex-K+ (12 nM) at 520 nm (Δ_F_ as described in the text) versus complementary strand concentration in KCl buffer, pH 7 at 20°C with different concentrations (wt/vol) of (a) ethylene glycol 0% (open square), 5% (open circle) and 10% (closed triangle) and (b) glycerol 0% (open square), 5% (open circle) and 10% (closed triangle).
Figure 6
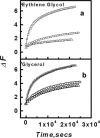
Opening up of the quadruplex-K+ (30 nM) at 20°C upon addition of equimolar concentration of C-strand measured in 50 mM MES buffer, pH 7 containing 100mM KCl in the presence of different concentrations of (a) ethylene glycol and (b) glycerol. Concentrations used were 0% (open square), 5% (open circle) and 10% (open triangle). For clarity only data points of 500 s interval are plotted for each dataset and the solid lines show exponential curves described in the text, to fit the data.
Figure 7
Plots of relative fluorescence emission intensity of Quadruplex-K+ (12 nM) (Δ_F_ as described in the text) versus complementary strand concentration in KCl buffer at 20°C with different concentrations of TMPyP4, 0 nM (open square), 60 nM (open circle) and 120 nM (closed triangle).
Figure 8
Opening up of the quadruplex-K+ (30 nM) at 20°C upon addition of equimolar C-strand measured in 50 mM MES buffer with 100 mM KCl, pH 7 in the absence and presence of 150 nM of TMPyP4. Plot showing 0 nM (open square), 150 nM (open circle) of TMPyP4.
Figure 9
Dependence of duplex formation at equilibrium on strand concentrations in a mixture of equimolar ratio of (G3TTA)3G3 and C3(TAAC3)3, under different experimental conditions The amount of duplex at equilibrium, _D_eq, was calculated from the binding affinity toward the complementary strand obtained from different experimental conditions, using the equation K = _D_eq/(_Q_0 − _D_eq) × (_C_0 − _D_eq), where _Q_0 and C0 (_Q_0 = _C_0) are the initial quadruplex and complementary strand concentration. Control (open circle), 10% ethylene glycol (plus sign), 10% glycerol (open triangle) and TMPyP4 (open square).
Similar articles
- Role of molecular crowding in perturbing quadruplex-Watson Crick duplex equilibrium.
Kumar N, Maiti S. Kumar N, et al. Nucleic Acids Symp Ser (Oxf). 2008;(52):157-8. doi: 10.1093/nass/nrn080. Nucleic Acids Symp Ser (Oxf). 2008. PMID: 18776301 - Quadruplex to Watson-Crick duplex transition of the thrombin binding aptamer: a fluorescence resonance energy transfer study.
Kumar N, Maiti S. Kumar N, et al. Biochem Biophys Res Commun. 2004 Jul 2;319(3):759-67. doi: 10.1016/j.bbrc.2004.05.052. Biochem Biophys Res Commun. 2004. PMID: 15184048 - Stabilization of guanine quadruplex DNA by the binding of porphyrins with cationic side arms.
Yamashita T, Uno T, Ishikawa Y. Yamashita T, et al. Bioorg Med Chem. 2005 Apr 1;13(7):2423-30. doi: 10.1016/j.bmc.2005.01.041. Bioorg Med Chem. 2005. PMID: 15755644 - Thermodynamic and kinetic characterization of the dissociation and assembly of quadruplex nucleic acids.
Hardin CC, Perry AG, White K. Hardin CC, et al. Biopolymers. 2000-2001;56(3):147-94. doi: 10.1002/1097-0282(2000/2001)56:3<147::AID-BIP10011>3.0.CO;2-N. Biopolymers. 2000. PMID: 11745110 Review. - Fluorescence resonance energy transfer in the studies of guanine quadruplexes.
Juskowiak B, Takenaka S. Juskowiak B, et al. Methods Mol Biol. 2006;335:311-41. doi: 10.1385/1-59745-069-3:311. Methods Mol Biol. 2006. PMID: 16785636 Review.
Cited by
- Human replication protein A unfolds telomeric G-quadruplexes.
Salas TR, Petruseva I, Lavrik O, Bourdoncle A, Mergny JL, Favre A, Saintomé C. Salas TR, et al. Nucleic Acids Res. 2006;34(17):4857-65. doi: 10.1093/nar/gkl564. Epub 2006 Sep 14. Nucleic Acids Res. 2006. PMID: 16973897 Free PMC article. - A novel G·G·T non-conventional intramolecular triplex formed by the double repeat sequence of Chlamydomonas telomeric DNA.
Bansal A, Phogat P, Kukreti S. Bansal A, et al. RSC Adv. 2022 May 26;12(25):15918-15924. doi: 10.1039/d2ra00861k. eCollection 2022 May 23. RSC Adv. 2022. PMID: 35733691 Free PMC article. - Characterization of a G-quadruplex from hepatitis B virus and its stabilization by binding TMPyP4, BRACO19 and PhenDC3.
Molnár OR, Végh A, Somkuti J, Smeller L. Molnár OR, et al. Sci Rep. 2021 Dec 1;11(1):23243. doi: 10.1038/s41598-021-02689-y. Sci Rep. 2021. PMID: 34853392 Free PMC article. - Distance-dependent duplex DNA destabilization proximal to G-quadruplex/i-motif sequences.
König SL, Huppert JL, Sigel RK, Evans AC. König SL, et al. Nucleic Acids Res. 2013 Aug;41(15):7453-61. doi: 10.1093/nar/gkt476. Epub 2013 Jun 14. Nucleic Acids Res. 2013. PMID: 23771141 Free PMC article. - Compatible solute influence on nucleic acids: many questions but few answers.
Kurz M. Kurz M. Saline Syst. 2008 Jun 3;4:6. doi: 10.1186/1746-1448-4-6. Saline Syst. 2008. PMID: 18522725 Free PMC article.
References
- Balagurumoorthy P., Brahmachari S.K. Structure and stability of human telomeric sequence. J. Biol. Chem. 1994;269:21858–21869. - PubMed
- Sen D., Gilbert W. Formation of parallel four-stranded complexes by guanine-rich motifs in DNA and its implications for meiosis. Nature. 1988;334:364–366. - PubMed
- Kilpatrick M.W., Torri A., Kang D.S., Engler J.A., Wells R.D. Unusual DNA structures in the adenovirus genome. J. Biol. Chem. 1986;261:11350–11354. - PubMed


