Cell type-specific dependence of muscarinic signalling in mouse hippocampal stratum oriens interneurones - PubMed (original) (raw)
Cell type-specific dependence of muscarinic signalling in mouse hippocampal stratum oriens interneurones
J Josh Lawrence et al. J Physiol. 2006.
Abstract
Cholinergic signalling is critically involved in learning and memory processes in the hippocampus, but the postsynaptic impact of cholinergic modulation on morphologically defined subtypes of hippocampal interneurones remains unclear. We investigated the influence of muscarinic receptor (mAChR) activation on stratum oriens interneurones using whole-cell patch clamp recordings from hippocampal slices in vitro. Upon somatic depolarization, mAChR activation consistently enhanced firing frequency and produced large, sustained afterdepolarizations (ADPs) of stratum oriens-lacunosum moleculare (O-LM) interneurones. In contrast, stratum oriens cell types with axon arborization patterns different from O-LM cells not only lacked large muscarinic ADPs but also appeared to exhibit distinct responses to mAChR activation. The ADP in O-LM cells, mediated by M1/M3 receptors, was associated with inhibition of an M current, inhibition of a slow calcium-activated potassium current, and activation of a calcium-dependent non-selective cationic current (ICAT). An examination of ionic conductances generated by firing revealed that calcium entry through ICAT controls the emergence of the mAChR-mediated ADP. Our results indicate that cholinergic specializations are present within anatomically distinct subpopulations of hippocampal interneurones, suggesting that there may be organizing principles to cholinergic control of GABA release in the hippocampus.
Figures
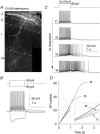
Figure 1. mAChR-induced ADPs are hallmark features of CA1 O-LM interneurones
A, O-LM interneurone recovered after whole cell recording and processed with fluorescently labelled avidin against intracellularly introduced biocytin. B, current clamp response of the O-LM interneurone in A. C–D, second-long 90 pA current injections from −60 mV were delivered every 15 s upon wash-in of 10 μ
m
muscarine. C, representative traces at progressive time points during wash-in of muscarine, illustrating elimination of the AHP and gain of a large ADP. Hz A and Hz B refer to the average action potential firing frequency during the first and second 500 ms of the current injection, respectively. D, plot of AP number versus time for traces t1–t4 in C. The slope of the dashed line indicates the average instantaneous AP frequency of the first 3 action potentials in t1; note that the t1 line is sublinear to the dashed line, denoting accommodation, while t2–t4 lines are supralinear, denoting acceleration in AP frequency.
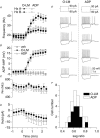
Figure 2. ADP-containing neurones and O-LM cells are highly overlapping cell populations
A, plot of the AP frequency of the first 500 ms (Hz A; squares) versus the second 500 ms (Hz B; circles) during wash-in indicates a loss of accommodation. Open symbols represent ADP-containing cells (_n_= 31), a subset of which was anatomically identified as O-LM interneurones (_n_= 12; filled symbols). B, plot of the average membrane potential in a time window for the slow AHP (a 200–300 ms time window 100 ms after offset of current injection) during wash-in of muscarine. Crossed open symbols indicate the average of 3 cells in which no agonist (veh) was applied. C and D, plots of input resistance (C) and holding current (D) upon application of muscarine for 12 ADP-containing cells (○), including 8 O-LM cells (•). Input resistance was monitored by the peak deflection to 1 s, −20 pA current step occurring 10 s after each depolarizing current injection. Holding current was manually applied to maintain the voltage at −60 mV and monitored through a separate analog input channel. E, voltage responses to ± 90 pA, 1 s current injections from −60 mV for 4 O-LM cells and 4 ADP-containing unidentified cells. F, histograms of sag ratios for 29 ADP-containing cells (open bars), 15 of which were O-LM cells (filled bars). Sag ratio was calculated by the average voltage deflection in a 10 ms window at the end of a 1 s, −90 pA step divided by the peak voltage deflection during the current step.
Figure 3. Stratum oriens interneurones with axonal arborizations and electrophysiological characteristics different from those of O-LM cells
Examples of stratum oriens interneurones that innervate stratum radiatum diffusely (A and B) or innervate stratum oriens and pyramidale (C and D). Scale bar: 100 μm. Insets, voltage responses to 1 s, +90 pA (red traces) or −90 pA (black traces) current injections from −60 mV. Scale bar: 50 mV, 500 ms. Cell layers o, p and r refer to stratum oriens, pyramidale and radiatum, respectively.
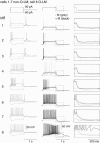
Figure 4. Other stratum oriens interneurone subtypes exhibit mAChR responses distinct from O-LM cells
For 7 morphologically identified non-O-LM cells (cells 1–7), voltage responses to 1 s, ± 90 pA somatic current injections from −60 mV (grey traces). Also illustrated for each cell is an overlay of the voltage response to a 90 pA somatic current injection upon mAChR activation (black) compared to control conditions (grey). Panels on the right indicated magnified views of the voltage responses upon termination of the current injection. Note that the O-LM cell (cell no. 8) is the only cell that elicits a large muscarinic ADP.
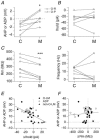
Figure 5. Electrophysiological differences between non-O-LM and O-LM cell populations
A_–_D, for 7 non-O-LM cells, plot of the magnitude of the AHP or ADP (average voltage amplitude in a 200–300 window 100 ms after the termination of the current injection) (A), holding current at −60 mV (B), input resistance (C), and firing frequency in the first 500 ms (D), in control (C) and in the presence of muscarine (M). For A–D, cells in which the axon ramified primarily in stratum radiatum (O-R) are indicated by squares; cells in which the axon ramified primarily in stratum pyramidale (O-P) are indicated by triangles. Note that O-R and O-P cells can be differentiated on the basis of mAChR effects of firing frequency. E, plot of the mAChR-induced AHP or ADP versus mAChR change in holding current at −60 mV for total of 35 cells, including 14 O-LM cells, 14 ADP-containing cells, and 7 non-O-LM cells. F, plot of magnitude of the AHP or ADP versus change in _R_m for the same cells as in E.
Figure 6. ACh-induced responses in stratum oriens interneurones
A, voltage responses to a 1 s, 90 pA current step from −60 mV before (grey) and after bath application of ACh (black). B, average voltage in a 200–300 ms window 100 ms after the offset of a +90 pA current injection in control conditions or in the presence of 100 μ
m
(squares) or 300 μ
m
(circles) acetylcholine for a population of 13 cells, including 2 O-LM cells (filled circles) and 2 non-O-LM cells (grey squares). C and D, same as A and B, but experiments were performed in the continued presence of nAChR antagonists α-BTX and MEC. E, summary graph of corresponding population data. Cell numbers (with anatomically identified O-LM cells in parentheses) are: vehicle, _n_= 3 (0); muscarine, _n_= 12 (12); ACh, _n_= 8 (2); ACh in the presence of nAChR antagonists (ACh +αBTX/MEC), _n_= 7 (2).
Figure 7. The mAChR-induced ADP in O-LM cells is mediated by M1/M3 mAChRs
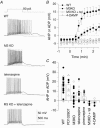
Experiments were conducted similar to Fig. 1_C–E_, but in slices from mAChR knockout (KO) mice and/or in the continued presence of mAChR antagonists present in both control and muscarine-containing solutions. A, representative traces from identified O-LM cells in WT animals, in a slice from a M3 KO mouse, in the presence of the M1 antagonist telenzepine, and in the presence of telenzepine in slices from a M3 KO mouse. B, plot of emergence of the ADP in WT (_n_= 12), in slices from M3 KO mice (_n_= 13), in the presence of telenzepine in M3 KO mice (_n_= 5), and from WT mice in the presence of 4-DAMP (_n_= 3), in anatomically identified O-LM cells. C, summary plot of amplitude of the AHP or ADP in the presence of mAChR antagonists and/or in mAChR KO mice. Identified O-LM cells are indicated as filled symbols. Circles denote WT; triangles denote M2 KO mice.
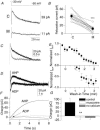
Figure 8. mAChR activation is associated with the inhibition of _I_M and _I_AHP, and the appearance of _I_CAT
A, a −20 mV step from a holding potential of −30 mV induces a relaxation of _I_M in control (upper trace), which is attenuated in the presence of 10 μ
m
muscarine (lower trace). Each trace is the average of 5 traces. Single exponential fits are shown in grey. B, cells associated with a mAChR-induced ADP exhibit a strong inhibition of _I_M by muscarine (***P < 0.001). Means are indicated by the filled circles. C, outward tail currents (measured at −50 mV) activated by a 600 ms step to 0 mV, delivered from a holding potential of −50 mV once every 15 s (black). The slow _I_AHP is inhibited in Ca2+-free solutions (grey). D, overlaid traces from control (black, labelled ‘AHP’) and in the presence of muscarine (black, labelled ‘ADP’) indicate the loss of _I_AHP and the appearance of _I_CAT (_n_= 5). _I_CAT is abolished in the presence of Ca2+-free solutions (grey). E, the time course of the inhibition of _I_AHP and appearance of _I_CAT during wash-in of muscarine. Normalization was based from a 10 ms window around peak outward or peak inward currents. F, cumulative charge upon integration of traces in E. G, muscarine significantly reduces the charge in a 6–8 s time window after the offset of the 50 mV depolarizing pulse (P < 0.01, _n_= 9).
Figure 9. KCNQ- and SK2-mediated K+ channels do not control the emergence of the ADP
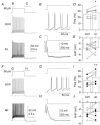
A, voltage response to the introduction of a 90 pA current step from −60 mV in control (cont; grey) and in the presence of linopirdine (lin; black). B and C illustrate overlaid regions in A at expanded time scales. D and E, plots of action potential frequency in the first 500 ms (D) or average membrane potential in a 200–300 ms time window 100 ms after offset of current injection (E) for 7 stratum oriens interneurones. F, voltage response to the introduction of a 90 pA current step from −60 mV in control (cont) and in the presence of apamin (ap). G and H illustrate regions in F at expanded time scales. I and J, plots of action potential frequency in the first 500 ms (I) or average membrane potential in a 200–300 ms time window 100 ms after offset of current injection (J) for 8 stratum oriens interneurones. Filled circles indicate anatomically identified O-LM cells.
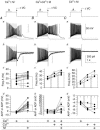
Figure 10. Ca2+ entry through _I_CAT controls the emergence of the mAChR-induced ADP
A–C, firing properties in the absence (−M; grey) or presence (+M; black) of muscarine examined with 2 m
m
CaCl2 present (_n_= 12) (A), 2 m
m
CaCl2+ 0.2 m
m
CdCl2 present (_n_= 7) (B), or with 0.2 CdCl2 alone (_n_= 4) (C). To reveal conductances activated as a consequence of firing, the amplifier was switched from current clamp (−VC; Aa–Ca) to voltage clamp mode (+VC; Ab–Cb) at the end of the 1 s current pulse. Panels c and d, summary of average changes in firing in the first 500 ms of the current pulse (Hz A) (Ac_–_Cc) or amplitude (Ad–Cd) of the AHP or ADP. Two cells in Bc and one cell in Cc were excluded because the action potential frequency could not be reliably measured because the level of depolarization induced Na+ channel inactivation in these conditions. Anatomically identified O-LM cells are indicated by filled circles.
Similar articles
- Activation of nicotinic acetylcholine receptors enhances a slow calcium-dependent potassium conductance and reduces the firing of stratum oriens interneurons.
Griguoli M, Scuri R, Ragozzino D, Cherubini E. Griguoli M, et al. Eur J Neurosci. 2009 Sep;30(6):1011-22. doi: 10.1111/j.1460-9568.2009.06914.x. Epub 2009 Sep 4. Eur J Neurosci. 2009. PMID: 19735287 - M3 muscarinic acetylcholine receptor expression confers differential cholinergic modulation to neurochemically distinct hippocampal basket cell subtypes.
Cea-del Rio CA, Lawrence JJ, Tricoire L, Erdelyi F, Szabo G, McBain CJ. Cea-del Rio CA, et al. J Neurosci. 2010 Apr 28;30(17):6011-24. doi: 10.1523/JNEUROSCI.5040-09.2010. J Neurosci. 2010. PMID: 20427660 Free PMC article. - Two distinct classes of muscarinic action on hippocampal inhibitory synapses: M2-mediated direct suppression and M1/M3-mediated indirect suppression through endocannabinoid signalling.
Fukudome Y, Ohno-Shosaku T, Matsui M, Omori Y, Fukaya M, Tsubokawa H, Taketo MM, Watanabe M, Manabe T, Kano M. Fukudome Y, et al. Eur J Neurosci. 2004 May;19(10):2682-92. doi: 10.1111/j.0953-816X.2004.03384.x. Eur J Neurosci. 2004. PMID: 15147302 - Stratum oriens horizontal interneurone diversity and hippocampal network dynamics.
Maccaferri G. Maccaferri G. J Physiol. 2005 Jan 1;562(Pt 1):73-80. doi: 10.1113/jphysiol.2004.077081. Epub 2004 Oct 21. J Physiol. 2005. PMID: 15498801 Free PMC article. Review. - Encoding and retrieval of episodic memories: role of cholinergic and GABAergic modulation in the hippocampus.
Hasselmo ME, Wyble BP, Wallenstein GV. Hasselmo ME, et al. Hippocampus. 1996;6(6):693-708. doi: 10.1002/(SICI)1098-1063(1996)6:6<693::AID-HIPO12>3.0.CO;2-W. Hippocampus. 1996. PMID: 9034856 Review.
Cited by
- Activation of muscarinic receptors by ACh release in hippocampal CA1 depolarizes VIP but has varying effects on parvalbumin-expressing basket cells.
Bell LA, Bell KA, McQuiston AR. Bell LA, et al. J Physiol. 2015 Jan 1;593(1):197-215. doi: 10.1113/jphysiol.2014.277814. Epub 2014 Nov 28. J Physiol. 2015. PMID: 25556796 Free PMC article. - Muscarinic receptor activation tunes mouse stratum oriens interneurones to amplify spike reliability.
Lawrence JJ, Grinspan ZM, Statland JM, McBain CJ. Lawrence JJ, et al. J Physiol. 2006 Mar 15;571(Pt 3):555-62. doi: 10.1113/jphysiol.2005.103218. Epub 2006 Jan 26. J Physiol. 2006. PMID: 16439425 Free PMC article. - Muscarinic cholinergic receptors modulate inhibitory synaptic rhythms in hippocampus and neocortex.
Alger BE, Nagode DA, Tang AH. Alger BE, et al. Front Synaptic Neurosci. 2014 Sep 5;6:18. doi: 10.3389/fnsyn.2014.00018. eCollection 2014. Front Synaptic Neurosci. 2014. PMID: 25249974 Free PMC article. Review. - Midazolam and atropine alter theta oscillations in the hippocampal CA1 region by modulating both the somatic and distal dendritic dipoles.
Balakrishnan S, Pearce RA. Balakrishnan S, et al. Hippocampus. 2014 Oct;24(10):1212-31. doi: 10.1002/hipo.22307. Epub 2014 Jun 7. Hippocampus. 2014. PMID: 24862458 Free PMC article. - Using multi-compartment ensemble modeling as an investigative tool of spatially distributed biophysical balances: application to hippocampal oriens-lacunosum/moleculare (O-LM) cells.
Sekulić V, Lawrence JJ, Skinner FK. Sekulić V, et al. PLoS One. 2014 Oct 31;9(10):e106567. doi: 10.1371/journal.pone.0106567. eCollection 2014. PLoS One. 2014. PMID: 25360752 Free PMC article.
References
- Aoki T, Baraban SC. Properties of a calcium-activated K+ current on interneurons in the developing rat hippocampus. J Neurophysiol. 2000;83:3453–3461. - PubMed
- Baude A, Nusser Z, Roberts JD, Mulvihill E, McIlhinney RA, Somogyi P. The metabotropic glutamate receptor (mGluR1 alpha) is concentrated at perisynaptic membrane of neuronal subpopulations as detected by immunogold reaction. Neuron. 1993;11:771–787. - PubMed
- Bhattacharjee A, Kaczmarek LK. For K+ channels, Na+ is the new Ca2+ Trends Neurosci. 2005;28:422–428. - PubMed
- Bhattacharjee A, von Hehn CA, Mei X, Kaczmarek LK. Localization of the Na+-activated K+ channel Slick in the rat central nervous system. J Comp Neurol. 2005;484:80–92. - PubMed
- Bischof WF, Boulanger P. Spatial navigation in virtual reality environments: an EEG analysis. Cyberpsychol Behav. 2003;6:487–495. - PubMed
Publication types
MeSH terms
Substances
LinkOut - more resources
Full Text Sources
Other Literature Sources
