Global analysis of proliferation and cell cycle gene expression in the regulation of hematopoietic stem and progenitor cell fates - PubMed (original) (raw)
Global analysis of proliferation and cell cycle gene expression in the regulation of hematopoietic stem and progenitor cell fates
Emmanuelle Passegué et al. J Exp Med. 2005.
Abstract
Knowledge of the molecular networks controlling the proliferation and fate of hematopoietic stem cells (HSC) is essential to understand their function in maintaining blood cell production during normal hematopoiesis and upon clinical transplantation. Using highly purified stem and progenitor cell populations, we define the proliferation index and status of the cell cycle machinery at discrete stages of hematopoietic differentiation and during cytokine-mediated HSC mobilization. We identify distinct sets of cell cycle proteins that specifically associate with differentiation, self-renewal, and maintenance of quiescence in HSC and progenitor cells. Moreover, we describe a striking inequality of function among in vivo cycling and quiescent HSC by demonstrating that their long-term engraftment potential resides predominantly in the G(0) fraction. These data provide a direct link between HSC proliferation and function and identify discrete molecular targets in regulating HSC cell fate decisions that could have implications for both the therapeutic use of HSC and the understanding of leukemic transformation.
Figures
Figure 1.
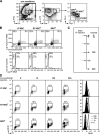
Cell cycle status in the pool of multipotent bone marrow cells. (A) FACS sorting conditions used to purify LT-HSC, ST-HSCF, and MPPF. (B) Cell cycle analyses of purified populations by H/PY (top, contour plot) and PI (bottom, histogram) staining. The percentages of cells in G0 (H2N/PY−), G1 (H2N/PY+), or S-G2/M (H>2N-4N/PY+) and in sub2N (<2N), G0/G1 (=2N), S (>2N and <4N), and/or G2/M (=4N) are indicated. (C) Scheme of the BrdU incorporation experiment. 1 mg BrdU (n = 20 mice/time point) was injected intraperitoneally at the start of the kinetic (t = 0) and every 6 h thereafter, and BM cells were harvested after 1 h (t = 1 h; one injection of BrdU), 12 h (t = 12 h; two injections of BrdU), and 24 h (t = 24 h; four injections of BrdU). (D) Short-term kinetics of BrdU incorporation. At the indicated time after BrdU injection, each population was purified by double FACS sorting, and analyzed by flow cytometry for BrdU/PI staining (dot plots). The percentage of BrdU+ cells is indicated (*, potential background). Histograms (right) indicate the changes over time in BrdU fluorescence intensity.
Figure 2.
Cell cycle status in progenitor and mature cell populations. (A and B) FACS sorting conditions used to purify myeloid progenitors (CMP, GMP, and MEP), mature Gr, lymphoid progenitors (CLP), and mature splenic B cells (B). (C and D) Short-term kinetics of BrdU incorporation (n = 5 mice/time point). At the indicated time after BrdU injection, each population was first purified by double FACS sorting and then analyzed by flow cytometry for BrdU/PI staining (dot plots). The percentages of BrdU+ cells are indicated. Histograms on the left represent intracellular PI staining (with the percentage of cells in G0/G1, S, and/or G2/M indicated), and histograms on the right represent the changes over time in BrdU fluorescence intensity.
Figure 3.
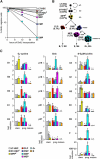
Proliferation index and status of the cell cycle machinery during hematopoietic differentiation. (A) Semilogarithmic plot giving the proportion of BrdU-negative stem and progenitor cells. (B) Schematic and color coded representation correlating the proliferation index (right) of each stem and progenitor compartment with their frequency in vivo (left). The different lineages of mature cells produced by each progenitor population are also indicated. B, B lymphocytes; T, T lymphocytes; NK: natural killer cells; E: erythrocytes; Mk: megakaryocytes; MΦ: macrophages. (C) Analysis by qRT-PCR of the expression levels of various components and regulators of the cell cycle machinery during hematopoietic differentiation. Each value has been standardized for β-actin expression levels. For each gene, the relative expression levels in stem, progenitor (prog), and mature cell (mature) populations are expressed as fold induction compared with the levels (set to 1) detected in LT-HSC (except for cyclin B1, in which ST-HSCF was used instead). Results (means ± SD) are obtained from three independently sorted sets of populations. *, P ≤ 0.001; Δ, P ≤ 0.01; o, P ≤ 0.05. nd, not detectable.
Figure 4.
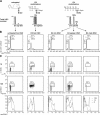
Cell cycle status in mobilized HSC. (A) Schematic of the Cy/G treatment used to mobilize HSC. Mice were injected intraperitoneally with a single dose of Cy (4 mg/mouse) and injected subcutaneously with recombinant human G (5 μg/mouse) for two successive days (D2 Cy/G treatment) or 4 successive days (D4 Cy/G treatment). For the BrdU experiments, mice were injected intraperitoneally with BrdU (n = 15 normal mice, 3 D2 mice, or 7 D4 mice, respectively, per time point) 1 h (t = 1 h) or 12 h (t = 12 h, with repeated injection at 6 h) before killing them at the end of the D2 or D4 Cy/G treatment. Histograms illustrate the increased numbers of KTLS HSC found in BM, spleen (spl), blood (bld), or mpb at D2 and D4 Cy/G treatment compared with untreated mice (reference 4). (B) Intracellular PI staining analysis of DNA content. The percentages of cells in G0/G1, S, and/or G2/M are indicated. (C) Kinetics of BrdU incorporation. At the indicated times after BrdU injection, each population of HSC was first purified by double FACS sorting and then analyzed by flow cytometry for BrdU/PI staining (dot plots). The percentages of BrdU+ cells are indicated. Histograms at the bottom indicate the changes over time in BrdU fluorescence intensity.
Figure 5.
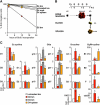
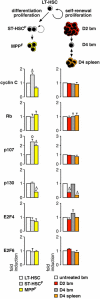
Proliferation index and status of cell cycle machinery during HSC mobilization. (A) Semilogarithmic plot giving the proportion of BrdU-negative HSC in untreated mice and mice that received D2 and D4 Cy/G treatment. (B) Schematic and color-coded representation correlating the proliferation index of each HSC population following D2 and D4 Cy/G treatment with their pool size in vivo. (C) Analysis by qRT-PCR of the expression levels of various components and regulators of the cell cycle machinery following D2 and D4 Cy/G treatment. Results represent means ± SD of duplicate measurement performed on three independently sorted sets of HSC populations. Each value has been standardized for β-actin expression levels and is expressed as fold induction compared with the levels (set to 1) detected in untreated BM HSC. *, P ≤ 0.001; Δ, P ≤ 0.01; o, P ≤ 0.05.
Figure 6.
Molecular control of quiescence. Analysis by qRT-PCR of the expression levels of various regulators of G0 or G0/G1 phase transition in homeostatic proliferation during LT-HSC differentiation toward ST-HSCF and MPPF and stress-induced HSC self-renewing proliferation following D2 and D4 Cy/G treatment. The results represent the means ± SD of duplicate measurements performed on three independently sorted sets of populations. Each value has been standardized for β-actin expression levels and is expressed as fold induction compared with the levels (set to 1) detected in LT-HSC or untreated BM HSC. *, P ≤ 0.001; Δ, P ≤ 0.01; o, P ≤ 0.05.
Figure 7.
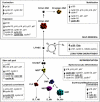
Molecular networks linking proliferation and cell fate decision in HSC and progenitor cells. Summary of the proliferation index, phase of the cell cycle, and status of the cell cycle machinery associated with differentiation, self-renewal, or long-term engraftment capacity in HSC and progenitor cells. Several regulators of the cell cycle found to be specifically associated with maintenance of quiescence, differentiation, self-renewal, expansion, and mobilization are identified (underlined and bold). Such genes represent potential targets to encourage self-renewal, prevent differentiation, and reestablish quiescence during ex vivo expansion of HSC for clinical transplantation. They also represent potential targets for deregulation during leukemic transformation.
Similar articles
- Hematopoietic stem and progenitor cells: clinical and preclinical regeneration of the hematolymphoid system.
Shizuru JA, Negrin RS, Weissman IL. Shizuru JA, et al. Annu Rev Med. 2005;56:509-38. doi: 10.1146/annurev.med.54.101601.152334. Annu Rev Med. 2005. PMID: 15660525 Review. - Rb is dispensable for self-renewal and multilineage differentiation of adult hematopoietic stem cells.
Walkley CR, Orkin SH. Walkley CR, et al. Proc Natl Acad Sci U S A. 2006 Jun 13;103(24):9057-62. doi: 10.1073/pnas.0603389103. Epub 2006 Jun 5. Proc Natl Acad Sci U S A. 2006. PMID: 16754850 Free PMC article. - Mechanisms controlling hematopoietic stem cell functions during normal hematopoiesis and hematological malignancies.
Warr MR, Pietras EM, Passegué E. Warr MR, et al. Wiley Interdiscip Rev Syst Biol Med. 2011 Nov-Dec;3(6):681-701. doi: 10.1002/wsbm.145. Epub 2011 Mar 15. Wiley Interdiscip Rev Syst Biol Med. 2011. PMID: 21412991 Review. - Cell intrinsic alterations underlie hematopoietic stem cell aging.
Rossi DJ, Bryder D, Zahn JM, Ahlenius H, Sonu R, Wagers AJ, Weissman IL. Rossi DJ, et al. Proc Natl Acad Sci U S A. 2005 Jun 28;102(26):9194-9. doi: 10.1073/pnas.0503280102. Epub 2005 Jun 20. Proc Natl Acad Sci U S A. 2005. PMID: 15967997 Free PMC article. - Role of SALL4 in hematopoiesis.
Yang J, Liao W, Ma Y. Yang J, et al. Curr Opin Hematol. 2012 Jul;19(4):287-91. doi: 10.1097/MOH.0b013e328353c684. Curr Opin Hematol. 2012. PMID: 22555391 Review.
Cited by
- Targeting cell cycle regulators in hematologic malignancies.
Aleem E, Arceci RJ. Aleem E, et al. Front Cell Dev Biol. 2015 Apr 9;3:16. doi: 10.3389/fcell.2015.00016. eCollection 2015. Front Cell Dev Biol. 2015. PMID: 25914884 Free PMC article. Review. - FLT3-ITD knockin impairs hematopoietic stem cell quiescence/homeostasis, leading to myeloproliferative neoplasm.
Chu SH, Heiser D, Li L, Kaplan I, Collector M, Huso D, Sharkis SJ, Civin C, Small D. Chu SH, et al. Cell Stem Cell. 2012 Sep 7;11(3):346-58. doi: 10.1016/j.stem.2012.05.027. Cell Stem Cell. 2012. PMID: 22958930 Free PMC article. - Bcl11a Deficiency Leads to Hematopoietic Stem Cell Defects with an Aging-like Phenotype.
Luc S, Huang J, McEldoon JL, Somuncular E, Li D, Rhodes C, Mamoor S, Hou S, Xu J, Orkin SH. Luc S, et al. Cell Rep. 2016 Sep 20;16(12):3181-3194. doi: 10.1016/j.celrep.2016.08.064. Cell Rep. 2016. PMID: 27653684 Free PMC article. - Constitutive MAP kinase activation in hematopoietic stem cells induces a myeloproliferative disorder.
Chung E, Hsu CL, Kondo M. Chung E, et al. PLoS One. 2011;6(12):e28350. doi: 10.1371/journal.pone.0028350. Epub 2011 Dec 2. PLoS One. 2011. PMID: 22164275 Free PMC article. - The cytosolic protein G0S2 maintains quiescence in hematopoietic stem cells.
Yamada T, Park CS, Burns A, Nakada D, Lacorazza HD. Yamada T, et al. PLoS One. 2012;7(5):e38280. doi: 10.1371/journal.pone.0038280. Epub 2012 May 31. PLoS One. 2012. PMID: 22693613 Free PMC article.
References
- Weissman, I.L. 2000. Stem cells: units of development, units of regeneration, and units of evolution. Cell. 100:157–168. - PubMed
- Bradford, G.B., B. Williams, R. Rossi, and I. Bertoncello. 1997. Quiescence, cycling, and turnover in the primitive hematopoietic stem cell compartment. Exp. Hematol. 25:445–453. - PubMed
- Wright, D.E., S.H. Cheshier, A.J. Wagers, T.D. Randall, J.L. Christensen, and I.L. Weissman. 2001. Cyclophosphamide/granulocyte colony-stimulating factor causes selective mobilization of bone marrow hematopoietic stem cells into the blood after M phase of the cell cycle. Blood. 97:2278–2285. - PubMed
Publication types
MeSH terms
LinkOut - more resources
Full Text Sources
Other Literature Sources
Medical
