UniFrac: a new phylogenetic method for comparing microbial communities - PubMed (original) (raw)
Comparative Study
UniFrac: a new phylogenetic method for comparing microbial communities
Catherine Lozupone et al. Appl Environ Microbiol. 2005 Dec.
Abstract
We introduce here a new method for computing differences between microbial communities based on phylogenetic information. This method, UniFrac, measures the phylogenetic distance between sets of taxa in a phylogenetic tree as the fraction of the branch length of the tree that leads to descendants from either one environment or the other, but not both. UniFrac can be used to determine whether communities are significantly different, to compare many communities simultaneously using clustering and ordination techniques, and to measure the relative contributions of different factors, such as chemistry and geography, to similarities between samples. We demonstrate the utility of UniFrac by applying it to published 16S rRNA gene libraries from cultured isolates and environmental clones of bacteria in marine sediment, water, and ice. Our results reveal that (i) cultured isolates from ice, water, and sediment resemble each other and environmental clone sequences from sea ice, but not environmental clone sequences from sediment and water; (ii) the geographical location does not correlate strongly with bacterial community differences in ice and sediment from the Arctic and Antarctic; and (iii) bacterial communities differ between terrestrially impacted seawater (whether polar or temperate) and warm oligotrophic seawater, whereas those in individual seawater samples are not more similar to each other than to those in sediment or ice samples. These results illustrate that UniFrac provides a new way of characterizing microbial communities, using the wealth of environmental rRNA sequences, and allows quantitative insight into the factors that underlie the distribution of lineages among environments.
Figures
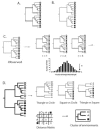
FIG. 1.
Calculation of the UniFrac distance metric. Squares, triangles, and circles denote sequences derived from different communities. Branches attached to nodes are colored black if they are unique to a particular environment and gray if they are shared. (A) Tree representing phylogenetically similar communities, where a significant fraction of the branch length in the tree is shared (gray). (B) Tree representing two communities that are maximally different so that 100% of the branch length is unique to either the circle or square environment. (C) Using the UniFrac metric to determine if the circle and square communities are significantly different. For n replicates (r), the environment assignments of the sequences were randomized, and the fraction of unique (black) branch lengths was calculated. The reported P value is the fraction of random trees that have at least as much unique branch length as the true tree (arrow). If this P value is below a defined threshold, the samples are considered to be significantly different. (D) The UniFrac metric can be calculated for all pairwise combinations of environments in a tree to make a distance matrix. This matrix can be used with standard multivariate statistical techniques such as UPGMA and principal coordinate analysis to compare the biotas in the environments.
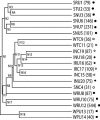
FIG. 2.
UPGMA cluster of marine samples. The number of sequences that represent each environment is indicated next to the sample name, as well as the symbol with which the sample is represented in Fig. 3.
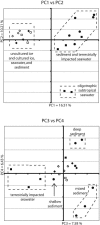
FIG. 3.
First four principal coordinates from a principal coordinate analysis of marine samples. Samples from marine ice are represented by diamonds, sediment samples are represented by circles, and water samples are represented by squares. Shapes representing samples derived from cultured isolates are open, and those representing samples from environmental clones are filled. The percentages in the axis labels represent the percentages of variation explained by the principal coordinates.
References
- Acinas, S. G., V. Klepac-Ceraj, D. E. Hunt, C. Pharino, I. Ceraj, D. L. Distel, and M. F. Polz. 2004. Fine-scale phylogenetic architecture of a complex bacterial community. Nature 430:551-554. - PubMed
Publication types
MeSH terms
Substances
LinkOut - more resources
Full Text Sources
Other Literature Sources
Medical


