Structural changes involved in protein binding correlate with intrinsic motions of proteins in the unbound state - PubMed (original) (raw)
Structural changes involved in protein binding correlate with intrinsic motions of proteins in the unbound state
Dror Tobi et al. Proc Natl Acad Sci U S A. 2005.
Abstract
Protein-protein binding usually involves structural changes that may extend beyond the rearrangements on a local scale, and cannot be explained by a classical lock-and-key mechanism. Several models have been advanced to explain the flexible binding of proteins such as the induced fit mechanism where the ligand is postulated to induce a conformational change at the interaction site upon binding, or the preexisting equilibrium hypothesis that assumes that protein samples an ensemble of conformations at equilibrium conditions and that the ligand binds selectively to an active conformation. We explored the equilibrium motions of proteins that exhibit relatively large (nonlocal) conformational changes upon protein binding using the Gaussian network model and the anisotropic network model of protein dynamics. For four complexes, LIR-1/HLA-A2, Actin/DNase I, CDK2/cyclin, and CDK6/p16(INK4a), the motions calculated for the monomer exhibiting the largest conformational change, in its unbound (free) form, correlate with the experimentally observed structural changes upon binding. This study emphasizes the preexisting equilibrium/conformational selection as a mechanism for protein-protein interaction and lends support the concept that proteins, in their native conformation, are predisposed to undergo conformational fluctuations that are relevant to, or even required for, their biological functions.
Figures
Fig. 1.
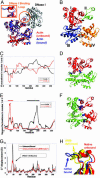
LIR-1 structure and dynamics and comparison with LIR-1/HLA-A2 complex. (A) Comparison of the structures of LIR-1 in the unbound (red) and bound (blue) conformations. The bound form refers to the complex formed with HLA-A2 (black). The domains 1 (D1; residues 4–96) of the two LIR-1 structures are superimposed. The angle between the domains D1 and D2 of LIR-1 is observed to open up by 10–16° in the complex (15). (B) Difference in Cα positions between unbound and bound LIR-1 (black curve), and between unbound and its deformed form driven by ANM mode 3 (red curve). The close similarity between the two curves suggests that the structural change between the bound and unbound forms of LIR-1 is ensured by the fluctuations of the protein along this particular mode of motion, which are already favored/accessible before substrate recognition and binding. (C) Displacements along the first principal mode predicted by the GNM, showing that the motions of the domains D1 and D2 are anticorrelated motion. The inversion in the direction of fluctuations occurs at residues V95 and T96 (global hinge center). (D) Square fluctuations of residues in GNM mode 1. Three local minima (cyan bar) are observed, in addition to the global minimum at hinge region (blue bar), which cluster in the interface between the two domains, as illustrated in E. The ribbon diagram in E is colored by the domains and hinge regions indicated by the bars in D. The ribbon diagrams in all figures were drawn by using
pymol
(44).
Fig. 2.
Actin structure and dynamics and comparison with the actin/DNase I complex. (A) The actin/DNase I complex is colored blue (actin) and black (DNase I); the structure of actin in the unbound state is shown in red. The DNase I-binding loop of actin (circled in orange, enlarged in Inset) changes its conformation from a helix to a β-turn upon complexation. (B) Actin is composed of four subdomains: I (residues 1–32, 70–144, and 338–372), II (33–69), III (145–180 and 270–337), and IV (181–269) (16). (C) Motions along GNM modes 1 and 2 as a function of residue index, computed for actin in the unbound form, the corresponding ribbon diagrams (D and F) colored according to the correlations revealed in C, and the associated square fluctuations in residue positions (E). In mode 1, subdomains I and II (red in D) undergo en bloc fluctuations opposite in direction to those of subdomains III and IV (green in D), the residues R147–T148 and A331–P332 serving as hinge regions (shown as blue beads). In the second mode, subdomains I and III move in opposite direction with respect to subdomains II and IV (E); residues 12–13, 17–18, 29–30, 95–96, 181–182, and 259–260 lie at the interface between these pairs of domains. (G) Comparison between experimentally observed (black curve) and theoretically predicted (red curve) displacements in Cα atoms between the unbound and bound forms of actin. Experimental data result from the comparison of two known structures (see Data Set). Theoretical results are obtained by deforming the unbound structure along the ANM mode 1 (see Methods). Whereas the overall deformation pattern is closely captured by this mode, the predicted displacement (5 Å) at the DNase I-binding loop falls short of the experimentally observed one (11 Å). (H) Conformation of the DNase binding loop in the unbound (red), ANM-deformed (yellow), and bound (blue) conformations.
Fig. 3.
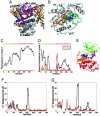
CDK structure and dynamics and comparison with complexes CDK2/cyclin A and CDK6/INK4. (A) Structure of CDK2/6 in complex with INK4 and cyclin A. The C-lobe of the CDKs in the two complexes are optimally superimposed to visualize the structural changes in the N-lobe (blue in the complex with cyclin and red in the complex with INK4), and in activation loops (cyan and orange, respectively). (B) Closer view of the activation loop in the unbound state of CDK (green), INK4-bound state (orange), and cyclin-bound state (cyan); in addition, the deformed conformation of the activation loop along the two fluctuating directions of the ANM mode 19 are shown in red and blue. (C_–_E) GNM dynamics of unbound CDK2. The motions along the first GNM mode are shown in C, and corresponding square fluctuations are shown in D (black curve). The N-lobe (residues 1–96; green bar along the upper abscissa) and the C-lobe (residues 166–298; red bar) move in opposite directions. Three sets of residues, L87–F90, P130–Q131, and V164–T165, lie at the interface between these anticorrelated regions. D also shows the square fluctuations induced in GNM mode five (red curve), which induces in the activation loop (residues 148–163, purple bar) motions comparable with those of the C-lobe in the first mode. (E) Ribbon diagram of CDK2 color coded according to the bars in D; hinge residues are shown as blue spheres. (F and G) Comparison of the experimentally observed change in Cα positions (difference between bound and unbound forms after optimal superimposition of the C-lobe; black curve) with the ANM-predicted deformations (red curve), shown for the complexes with cyclin (F) and p16INK4a (G). The αC region is missing in the CDK6 structure, resulting in the observed gap between residues 37–58. The similarity between the two curves in both panels indicates that CDK has the intrinsic tendency to undergo lobe movements to facilitate substrate binding, unlike the activation loop.
Fig. 4.
Models for protein–protein interactions. (A) Lock-and-key mechanism. (B) Induced Fit. (C) Preexisting equilibrium followed by induced fit.
Similar articles
- Folding funnels and conformational transitions via hinge-bending motions.
Kumar S, Ma B, Tsai CJ, Wolfson H, Nussinov R. Kumar S, et al. Cell Biochem Biophys. 1999;31(2):141-64. doi: 10.1007/BF02738169. Cell Biochem Biophys. 1999. PMID: 10593256 Review. - Allosteric coupling and conformational fluctuations in proteins.
Onaran HO, Costa T. Onaran HO, et al. Curr Protein Pept Sci. 2009 Apr;10(2):110-5. doi: 10.2174/138920309787847644. Curr Protein Pept Sci. 2009. PMID: 19355978 - Binding induced conformational changes of proteins correlate with their intrinsic fluctuations: a case study of antibodies.
Keskin O. Keskin O. BMC Struct Biol. 2007 May 17;7:31. doi: 10.1186/1472-6807-7-31. BMC Struct Biol. 2007. PMID: 17509130 Free PMC article. - Fluctuations within folded proteins: implications for thermodynamic and allosteric regulation.
DuBay KH, Bowman GR, Geissler PL. DuBay KH, et al. Acc Chem Res. 2015 Apr 21;48(4):1098-105. doi: 10.1021/ar500351b. Epub 2015 Feb 17. Acc Chem Res. 2015. PMID: 25688669 Review.
Cited by
- Role of Hsp70 ATPase domain intrinsic dynamics and sequence evolution in enabling its functional interactions with NEFs.
Liu Y, Gierasch LM, Bahar I. Liu Y, et al. PLoS Comput Biol. 2010 Sep 16;6(9):e1000931. doi: 10.1371/journal.pcbi.1000931. PLoS Comput Biol. 2010. PMID: 20862304 Free PMC article. - Intramolecular Domain Movements of Free and Bound pMHC and TCR Proteins: A Molecular Dynamics Simulation Study.
Karch R, Stocsits C, Ilieva N, Schreiner W. Karch R, et al. Cells. 2019 Jul 13;8(7):720. doi: 10.3390/cells8070720. Cells. 2019. PMID: 31337065 Free PMC article. - A stepwise docking molecular dynamics approach for simulating antibody recognition with substantial conformational changes.
Huang Y, Li Z, Hong Q, Zhou L, Ma Y, Hu Y, Xin J, Li T, Kong Z, Zheng Q, Chen Y, Zhao Q, Gu Y, Zhang J, Wang Y, Yu H, Li S, Xia N. Huang Y, et al. Comput Struct Biotechnol J. 2022 Jan 18;20:710-720. doi: 10.1016/j.csbj.2022.01.012. eCollection 2022. Comput Struct Biotechnol J. 2022. PMID: 35198128 Free PMC article. - Structural Consideration of the Working Mechanism of Fold Type I Transaminases From Eubacteria: Overt and Covert Movement.
Kwon S, Park HH. Kwon S, et al. Comput Struct Biotechnol J. 2019 Jul 23;17:1031-1039. doi: 10.1016/j.csbj.2019.07.007. eCollection 2019. Comput Struct Biotechnol J. 2019. PMID: 31452855 Free PMC article. Review. - Toward a molecular understanding of the anisotropic response of proteins to external forces: insights from elastic network models.
Eyal E, Bahar I. Eyal E, et al. Biophys J. 2008 May 1;94(9):3424-35. doi: 10.1529/biophysj.107.120733. Epub 2008 Jan 25. Biophys J. 2008. PMID: 18223005 Free PMC article.
References
- Fischer, E. (1894) Ber. Dtsch. Chem. Ges. 27, 2984–2993.
- Chen, R., Mintseris, J., Janin, J. & Weng, Z. (2003) Proteins 52, 88–91. - PubMed
- Goh, C. S., Milburn, D. & Gerstein, M. (2004) Curr. Opin. Struct. Biol. 14, 104–109. - PubMed
- Betts, M. J. & Sternberg, M. J. (1999) Protein Eng. 12, 271–283. - PubMed
Publication types
MeSH terms
Substances
LinkOut - more resources
Full Text Sources
Other Literature Sources
Research Materials


