Caveolin-1 confers antiinflammatory effects in murine macrophages via the MKK3/p38 MAPK pathway - PubMed (original) (raw)
Caveolin-1 confers antiinflammatory effects in murine macrophages via the MKK3/p38 MAPK pathway
Xiao Mei Wang et al. Am J Respir Cell Mol Biol. 2006 Apr.
Abstract
Caveolin-1 has been reported to regulate apoptosis, lipid metabolism, and endocytosis in macrophages. In the present study, we demonstrate that caveolin-1 can act as a potent immunomodulatory molecule. We first observed caveolin-1 expression in murine alveolar macrophages by Western blotting and immunofluorescence microscopy. Loss-of-function experiments using small interfering RNA showed that down regulating caveolin-1 expression in murine alveolar and peritoneal macrophages increased LPS-induced proinflammatory cytokine TNF-alpha and IL-6 production but decreased anti-inflammatory cytokine IL-10 production. Gain-of-function experiments demonstrated that overexpression of caveolin-1 in RAW264.7 cells decreased LPS-induced TNF-alpha and IL-6 production and augmented IL-10 production. p38 mitogen-activated protein kinase (MAPK) phosphorylation was increased by overexpressing caveolin-1 in RAW264.7 cells, whereas c-Jun N-terminal kinase, extracellular signal-regulated kinase MAPK, and Akt phosphorylation were inhibited. The antiinflammatory modulation of LPS-induced cytokine production by caveolin-1 was significantly abrogated by the administration of p38 inhibitor SB203580 in RAW264.7 cells. Peritoneal macrophages isolated from MKK3 null mice did not demonstrate any modulation of LPS-induced cytokine production by caveolin-1. LPS-induced activation of NF-kappaB and AP-1 determined by electrophoretic mobility shift assay were significantly reduced by overexpressing caveolin-1 in RAW264.7 cells. The reductions were attenuated by the administration of p38 inhibitor SB203580. Taken together, our data suggest that caveolin-1 acts as a potent immunomodulatory effector molecule in immune cells and that the regulation of LPS-induced cytokine production by caveolin-1 involves the MKK3/p38 MAPK pathway.
Figures
**Figure 1.
Caveolin-1 expression in murine AMs. Murine AMs were isolated and cultured. (A) Caveolin-1 and β-actin expressions were determined by Western blot analysis along with murine PMs and NIH3T3 fibroblasts. (B) Immunofluorescent staining of caveolin-1 and Mac-3 were performed in murine AMs. To investigate the quality of the AMs, we performed murine macrophage specific marker Mac-3 staining. Isolated cells were subjected to immunofluorescent microscopy. Cells (5 × 100) were counted, and the green-staining cells were regarded as macrophages. The positive staining cell of percentage is 94 ± 2%. Scale bar: 7 μm.
**Figure 2.
Modulation of LPS-induced cytokine production by downregulating caveolin-1 expression in murine AMs. Murine AMs were isolated and cultured. (A) The cells were transfected with siRNA of caveolin-1 and control siRNA for 24 h. Caveolin-1 and β-actin expressions were determined by Western blot analysis. After 24 h post-trasfection, the culture medium of transfected PMs was harvested with or without LPS treatment for 4 h. TNF-α (B), IL-6 (C), and IL-10 (D) cytokine production was determined by ELISA. Values are mean ± SE (n = 3). Data are representative of three independent experiments.
**Figure 3.
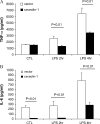
Overexpressing caveolin-1 in RAW264.7 modulates LPS-induced cytokines production. RAW264.7 cells stably transfected with caveolin-1, were serum starved for 24 h and administered LPS for 2 and 4 h. The culture medium was harvested. (A) TNF-α, (B) IL-6, and (C) IL-10 were determined by ELISA. Values were mean ± SE (n = 3). Data are representative of three independent experiments.
**Figure 4.
Modulation of MAPK and PI3K pathway by caveolin-1. After serum starvation for 24 h, RAW264.7 cells stably transfected with caveolin-1 gene and with control vector were treated with or without LPS for 10 min, 20 min, and 60 min. The cells were harvested and subjected to Western blot analysis for phosphorylated ERK1/2, JNK, p38, and Akt. The same blots were washed and blotting for total ERK1/2, JNK, p38, and Akt as the loading control. Data are representative of three independent experiments.
**Figure 5.
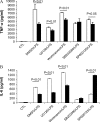
p38 and JNK pathway involved in the regulation of caveolin-1 on cytokines production. RAW264.7 cells stably transfected with caveolin-1 gene (filled bars) and with control vector (open bars) were serum starved for 24 h. The cells were pretreated for 2 h with DMSO with or without different chemicals dissolved, including UO126, Wortmannin, SB203580, and SP600125. The treated cells were then administrated LPS for 4 h. The culture media were harvested. Cytokines levels in culture medium (A) TNF-α, (B) IL-6, and (C) IL-10 were determined by ELISA. Values were means ± SE (n = 3). Data are representative of three independent experiments.
**Figure 6.
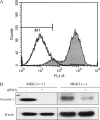
MKK3/p38 mediates the modulation of LPS induced cytokine production by caveolin-1. PMs were isolated and cultured from MKK3 (+/+) and MKK3 (−/−) mice. (A) To investigate the quality of the macrophages, we performed murine macrophage–specific marker Mac-3 staining. For PMs, the cells were subjected to flow cytometry. The positive staining cell of percentage is 95%. The cells were transfected with siRNA for caveolin-1 and the control siRNA. At 24 h post-transfection, the cells were treated with or without LPS for 4 h. The effects of siRNA transfection were determined by Western blot analysis (B). The culture medium was harvested. Medium cytokine levels TNF-α (C), IL-6 (D), and IL-10 (E) were determined by ELISA (bars in E are as for those in C and D). Values are means ± SE (n = 3). Data are representative of three independent experiments.
**Figure 7.
Effects of caveolin-1 on LPS induced NF-κB and AP-1 activation. RAW264.7 cells stably transfected with caveolin-1 gene and with control vector were serum starved for 24 h. After treatment with LPS for 0 min, 5 min, 15 min, 30 min, and 1 h, the cells were harvested. Nuclear proteins were extracted and subjected to EMSA for (A) NF-κB and (B) AP-1 activation. (C) Effects of SB203580 on LPS induced NF-κB and AP-1 activation. After serum starvation, RAW264.7 cells stably transfected with caveolin-1 gene and with control vector were pretreated with SB203580 or DMSO for 1 h. The nuclear proteins were extracted and subjected to EMSA for NF-κB and AP-1 activation. Cold oligonucleotides containing the transcription factor-binding site for NF-κB and AP-1 were added as a competition control, and cold oligonucleotides containing SP1 binding site were added as a negative competition control. Data are representative of three independent experiments.
Similar articles
- Estrogen attenuates lipopolysaccharide-induced nitric oxide production in macrophages partially via the nongenomic pathway.
Liu L, Wang Z. Liu L, et al. Cell Immunol. 2013 Nov-Dec;286(1-2):53-8. doi: 10.1016/j.cellimm.2013.11.004. Epub 2013 Nov 21. Cell Immunol. 2013. PMID: 24321566 - Anti-Inflammatory Effects of Chloranthalactone B in LPS-Stimulated RAW264.7 Cells.
Li X, Shen J, Jiang Y, Shen T, You L, Sun X, Xu X, Hu W, Wu H, Wang G. Li X, et al. Int J Mol Sci. 2016 Nov 22;17(11):1938. doi: 10.3390/ijms17111938. Int J Mol Sci. 2016. PMID: 27879664 Free PMC article. - Prodigiosin isolated from Hahella chejuensis suppresses lipopolysaccharide-induced NO production by inhibiting p38 MAPK, JNK and NF-kappaB activation in murine peritoneal macrophages.
Huh JE, Yim JH, Lee HK, Moon EY, Rhee DK, Pyo S. Huh JE, et al. Int Immunopharmacol. 2007 Dec 15;7(13):1825-33. doi: 10.1016/j.intimp.2007.09.002. Epub 2007 Oct 1. Int Immunopharmacol. 2007. PMID: 17996695 - Vibrio harveyi infections induce production of proinflammatory cytokines in murine peritoneal macrophages via activation of p38 MAPK and NF-κB pathways, but reversed by PI3K/AKT pathways.
Yu G, Yu H, Yang Q, Wang J, Fan H, Liu G, Wang L, Bello BK, Zhao P, Zhang H, Dong J. Yu G, et al. Dev Comp Immunol. 2022 Feb;127:104292. doi: 10.1016/j.dci.2021.104292. Epub 2021 Oct 14. Dev Comp Immunol. 2022. PMID: 34656643 Review. - Flavonoid diversity and roles in the lipopolysaccharide-mediated inflammatory response of monocytes and macrophages.
Rullah K, Shamsudin NF, Koeberle A, Tham CL, Fasihi Mohd Aluwi MF, Leong SW, Jantan I, Lam KW. Rullah K, et al. Future Med Chem. 2024 Jan;16(1):75-99. doi: 10.4155/fmc-2023-0174. Epub 2024 Jan 11. Future Med Chem. 2024. PMID: 38205612 Review.
Cited by
- Caveolin-1: A Review of Intracellular Functions, Tissue-Specific Roles, and Epithelial Tight Junction Regulation.
Dalton CM, Schlegel C, Hunter CJ. Dalton CM, et al. Biology (Basel). 2023 Nov 5;12(11):1402. doi: 10.3390/biology12111402. Biology (Basel). 2023. PMID: 37998001 Free PMC article. Review. - Moxifloxacin suppresses airway inflammation and modulates expression of caveolin-1 and flotillin-1 in airway smooth muscle cells of asthmatic rats.
Li HT, Ye C, Zhou M, Yang Y, Jin Q, Pan CF. Li HT, et al. Ann Transl Med. 2019 Sep;7(18):469. doi: 10.21037/atm.2019.08.43. Ann Transl Med. 2019. PMID: 31700905 Free PMC article. - Endothelial caveolae and caveolin-1 as key regulators of atherosclerosis.
Frank PG. Frank PG. Am J Pathol. 2010 Aug;177(2):544-6. doi: 10.2353/ajpath.2010.100247. Epub 2010 Jun 25. Am J Pathol. 2010. PMID: 20581059 Free PMC article. - Caveolar and non-Caveolar Caveolin-1 in ocular homeostasis and disease.
Enyong EN, Gurley JM, De Ieso ML, Stamer WD, Elliott MH. Enyong EN, et al. Prog Retin Eye Res. 2022 Nov;91:101094. doi: 10.1016/j.preteyeres.2022.101094. Epub 2022 Jun 18. Prog Retin Eye Res. 2022. PMID: 35729002 Free PMC article. Review. - Caveolin-1 influences vascular protease activity and is a potential stabilizing factor in human atherosclerotic disease.
Rodriguez-Feo JA, Hellings WE, Moll FL, De Vries JP, van Middelaar BJ, Algra A, Sluijter J, Velema E, van den Broek T, Sessa WC, De Kleijn DP, Pasterkamp G. Rodriguez-Feo JA, et al. PLoS One. 2008 Jul 2;3(7):e2612. doi: 10.1371/journal.pone.0002612. PLoS One. 2008. PMID: 18596970 Free PMC article.
References
- Palade GE. The fine structure of blood capillaries. J Appl Phys 1953; 24:1424.
- Rothberg KG, Heuser JE, Donzell WC, Ying YS, Glenney JR, Anderson RG. Caveolin, a protein component of caveolae membrane coats. Cell 1992;68:673–682. - PubMed
- Schlegel A, Volonte D, Engelman JA, Galbiati F, Mehta P, Zhang XL, Scherer PE, Lisanti MP, Silva W, Maldonado H, et al. Crowded little caves: structure and function of caveolae. Cell Signal 1998;10:457–463. - PubMed
Publication types
MeSH terms
Substances
Grants and funding
- P01-HL70807/HL/NHLBI NIH HHS/United States
- R01-HL060234/HL/NHLBI NIH HHS/United States
- R01-HL079904/HL/NHLBI NIH HHS/United States
- R01-HL55330/HL/NHLBI NIH HHS/United States
LinkOut - more resources
Full Text Sources
Molecular Biology Databases
Research Materials
Miscellaneous


