Dynamic regulation of replication independent deposition of histone H3 in fission yeast - PubMed (original) (raw)
Dynamic regulation of replication independent deposition of histone H3 in fission yeast
Eun Shik Choi et al. Nucleic Acids Res. 2005.
Abstract
Recently, a histone H3 variant in Drosophila and humans, the H3.3 protein, was shown to replace canonical H3 in active chromatin in a replication-independent (RI) manner. In the fission yeast Schizosaccharomyces pombe, there exists a single form of H3, which is equivalent to H3.3 and is thought to participate in both replication-independent (RI) and replication-coupled (RC) nucleosome assembly. In this study, we show that RI deposition of H3 at heterochromatic regions is consistently lower than that at a gene-free euchromatic region, and deletion of the conserved heterochromatin-specific proteins Swi6 or Clr4 markedly increases RI deposition at heterochromatic regions such as the silent mating-type loci or centromeres. These results clearly show that RI deposition of H3 occurs preferentially in euchromatic regions. We also observed that RI deposition of H3 could be increased at the thi3(+) gene when transcription is induced, indicating transcription further facilitates RI deposition of H3. Taken together, these observations demonstrate that selective deposition of histone H3.3 at transcriptionally active chromatin by the RI assembly pathway is conserved in fission yeast and, thus, our data support an essential role of histone H3 replacement in maintaining active chromatin among diverse eukaryotic organisms ranging from fission yeast to humans.
Figures
Figure 1
Exogenously expressed H3-HA and H4-HA are functional, as determined by their incorporation into centromeric regions. (A) Experimental strategy for incorporation of exogenous H3-HA or H4-HA in fission yeast (see text for details). (B) FACS analysis to monitor DNA content of cells treated with 25 mM HU at the indicated time points. Cells were fixed in 70% ethanol and analyzed by flow cytometry. (C) Induction of exogenous H3-HA or H4-HA in sucrose medium was analyzed by western blot with an HA antibody. Staining of the membrane with Ponceau red solution shows equal loading. (D) A diagram of centromere 1 and locations of primer pairs are shown on top. Primer pairs designated cnt1 and imr-1 are located within the central core region. Primer pairs designated imr-2, otr-1 and otr-2 are located within centromeric heterochromatin. Cells containing pINV1-H3-HA or pINV1-H4-HA grown in glucose medium with 25 mM HU for 6 h were subjected to ChIP with protein A Sepharose only (no Ab, control) or protein A Sepharose and HA antibody (α-HA). PCR with the designated primers was performed from the no Ab sample, α-HA sample, or WCE to detect incorporation of basally expressed H3-HA or H4-HA grown in glucose medium. The reference region is a gene-free euchromatic region of chromosome 2 (13023–13188). Relative centromeric enrichment shown beneath each lane was calculated by dividing the ratio of the centromeric loci/reference PCR products in the ChIP sample with that in the WCE sample. The experiments above were repeated at least twice, to ensure reproducibility.
Figure 2
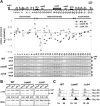
RI deposition of H3 and H4 occurs predominantly at euchromatic regions. (A) Deposition of H3 or H4 at the reporters ade6+, located in the heterochromatic mat3 locus, and ade6-DN/N, located in an endogenous euchromatic locus, in S.pombe grown in sucrose medium. The relative euchromatic enrichment shown beneath each lane was calculated by dividing the ratio of the ade6-DN/N/ade6+ PCR products in the ChIP sample with that in the WCE sample and the data are presented as the mean of triplicate measurements ± SD. (B) A diagram of the mat locus and the locations of primers used are shown at the top. IR-L and IR-R represent the left and right heterochromatin boundaries, respectively. ChIP analysis with an HA antibody was performed using cells expressing H3-HA or H4-HA in sucrose medium to measure their incorporation throughout the mat locus (1–33). Relative enrichment of H3-HA or H4-HA at each mat locus was calculated as the ratio of the PCR products in the ChIP sample to that in the WCE sample for each site (1–33). The ratio is plotted as a log scale and aligned with the map of the mat locus. The experiments above were repeated at least twice, to ensure reproducibility.
Figure 3
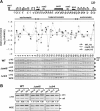
RI deposition of H3 at silent mat loci is increased by deletion of swi6+ or clr4+. (A) ChIP analysis with an HA antibody was performed with wild-type (WT), Δ_swi6_, or Δ_clr4_ cells expressing H3-HA in sucrose medium to measure its incorporation throughout the mat locus (sites 1–33). Relative enrichment of H3-HA in each strain was calculated and plotted as a log scale as described in Figure 2C. (B) The same ChIP samples used in (A) were subjected to PCR with primer pairs corresponding to centromeric heterochromatin (imr-2, otr-1 and otr-2), as shown in Figure 1C. (C) FACS analysis was performed to monitor DNA content of WT, Δ_swi6_, or Δ_clr4_ cells treated with 25 mM HU at the designated time points. The experiments above were repeated at least twice, to ensure reproducibility.
Figure 4
The total occupancy of histone H3 at the silent mat loci is not altered by deletion of swi6+ or clr4+. (A) ChIP analysis with an H3 antibody was performed with the same samples used in Figure 3 to measure H3 occupancy throughout the mat locus (sites 1–33). (B) The same ChIP samples were subjected to PCR with primer pairs corresponding to centromeric heterochromatin (imr-2, otr-1 and otr-2), as shown in Figure 1C. The experiments above were repeated at least twice, to ensure reproducibility.
Figure 5
Transcription enhances RI deposition of H3 at promoter and coding regions of thi3+. (A) A diagram showing the promoter (TATA) and coding region of the thi3+ gene. The location of each primer pair is shown on top. Samples grown in sucrose medium in the presence (+T) or absence of thiamine (−T) were subjected to ChIP analysis with an HA antibody or an RNA polymerase II (RNAP II) antibody. (B) The H3-HA enrichment at thi3+ in each sample was quantified and the relative enrichment of RI deposited H3-HA at each locus is shown as the mean ± SD of triplicate samples. (C) The total occupancy of histone H3 at thi3+ in each sample. The same extracts used in (A) were subjected to ChIP analysis with an anti H3 antibody to assess the level of total histone H3 bound to each locus. The experiments above were repeated at least twice, to ensure reproducibility.
Similar articles
- A chromodomain protein, Chp1, is required for the establishment of heterochromatin in fission yeast.
Sadaie M, Iida T, Urano T, Nakayama J. Sadaie M, et al. EMBO J. 2004 Oct 1;23(19):3825-35. doi: 10.1038/sj.emboj.7600401. Epub 2004 Sep 16. EMBO J. 2004. PMID: 15372076 Free PMC article. - Fission yeast chromatin assembly factor 1 assists in the replication-coupled maintenance of heterochromatin.
Dohke K, Miyazaki S, Tanaka K, Urano T, Grewal SI, Murakami Y. Dohke K, et al. Genes Cells. 2008 Oct;13(10):1027-43. doi: 10.1111/j.1365-2443.2008.01225.x. Epub 2008 Aug 29. Genes Cells. 2008. PMID: 18761674 - Epigenetic Regulation of Chromatin States in Schizosaccharomyces pombe.
Allshire RC, Ekwall K. Allshire RC, et al. Cold Spring Harb Perspect Biol. 2015 Jul 1;7(7):a018770. doi: 10.1101/cshperspect.a018770. Cold Spring Harb Perspect Biol. 2015. PMID: 26134317 Free PMC article. Review. - Transitions in distinct histone H3 methylation patterns at the heterochromatin domain boundaries.
Noma K, Allis CD, Grewal SI. Noma K, et al. Science. 2001 Aug 10;293(5532):1150-5. doi: 10.1126/science.1064150. Science. 2001. PMID: 11498594 - Histone H3 variants specify modes of chromatin assembly.
Ahmad K, Henikoff S. Ahmad K, et al. Proc Natl Acad Sci U S A. 2002 Dec 10;99 Suppl 4(Suppl 4):16477-84. doi: 10.1073/pnas.172403699. Epub 2002 Aug 12. Proc Natl Acad Sci U S A. 2002. PMID: 12177448 Free PMC article. Review.
Cited by
- Centromeric histone H2B monoubiquitination promotes noncoding transcription and chromatin integrity.
Sadeghi L, Siggens L, Svensson JP, Ekwall K. Sadeghi L, et al. Nat Struct Mol Biol. 2014 Mar;21(3):236-43. doi: 10.1038/nsmb.2776. Epub 2014 Feb 16. Nat Struct Mol Biol. 2014. PMID: 24531659 - A Light-Inducible Strain for Genome-Wide Histone Turnover Profiling in Neurospora crassa.
Storck WK, Abdulla SZ, Rountree MR, Bicocca VT, Selker EU. Storck WK, et al. Genetics. 2020 Jul;215(3):569-578. doi: 10.1534/genetics.120.303217. Epub 2020 May 1. Genetics. 2020. PMID: 32357961 Free PMC article. - Chromosome boundary elements and regulation of heterochromatin spreading.
Wang J, Lawry ST, Cohen AL, Jia S. Wang J, et al. Cell Mol Life Sci. 2014 Dec;71(24):4841-52. doi: 10.1007/s00018-014-1725-x. Epub 2014 Sep 7. Cell Mol Life Sci. 2014. PMID: 25192661 Free PMC article. Review. - New functions for an old variant: no substitute for histone H3.3.
Elsaesser SJ, Goldberg AD, Allis CD. Elsaesser SJ, et al. Curr Opin Genet Dev. 2010 Apr;20(2):110-7. doi: 10.1016/j.gde.2010.01.003. Epub 2010 Feb 12. Curr Opin Genet Dev. 2010. PMID: 20153629 Free PMC article. Review. - Asf1/HIRA facilitate global histone deacetylation and associate with HP1 to promote nucleosome occupancy at heterochromatic loci.
Yamane K, Mizuguchi T, Cui B, Zofall M, Noma K, Grewal SI. Yamane K, et al. Mol Cell. 2011 Jan 7;41(1):56-66. doi: 10.1016/j.molcel.2010.12.009. Mol Cell. 2011. PMID: 21211723 Free PMC article.
References
- Workman J.L., Kingston R.E. Alteration of nucleosome structure as a mechanism of transcriptional regulation. Annu. Rev. Biochem. 1998;67:545–579. - PubMed
- Mello J.A., Almouzni G. The ins and outs of nucleosome assembly. Curr. Opin. Genet. Dev. 2001;11:136–141. - PubMed
- Ray-Gallet D., Quivy J.P., Scamps C., Martini E.M., Lipinski M., Almouzni G. HIRA is critical for a nucleosome assembly pathway independent of DNA synthesis. Mol. Cell. 2002;9:1091–1100. - PubMed
- Ahmad K., Henikoff S. The histone variant H3.3 marks active chromatin by replication-independent nucleosome assembly. Mol. Cell. 2002;9:1191–1200. - PubMed


