A cancer DNA phenotype in healthy prostates, conserved in tumors and adjacent normal cells, implies a relationship to carcinogenesis - PubMed (original) (raw)
A cancer DNA phenotype in healthy prostates, conserved in tumors and adjacent normal cells, implies a relationship to carcinogenesis
Donald C Malins et al. Proc Natl Acad Sci U S A. 2005.
Abstract
A cancer DNA phenotype, identical to the DNA structure of tumors, has been identified in the prostate glands of certain healthy men over 55 years of age. We now show that the same DNA signature exists in normal tissues adjacent to tumors. This finding implies that the phenotype is maintained in normal prostate cells from its inception through tumor development. The presence of the phenotype in tumors, adjacent normal cells, and in the normal prostate cells of certain older men suggests that it is a potentially critical factor in tumor development and may serve as an early biomarker for cancer risk assessment. Intervention to inhibit the development of the phenotype in healthy men, or to eliminate it once formed, may suppress or even prevent tumor formation.
Figures
Fig. 1.
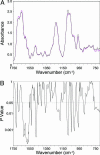
Significant differences in the base and backbone structures exist between the DNA of the younger men and that of the older men with the cancer DNA phenotype. (A) Comparison of FT-IR spectra of the DNA of younger men (black line; n = 9) and the cancer DNA phenotype in the older men (magenta line; n = 5). (B) Corresponding P values.
Fig. 2.
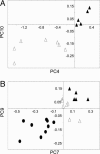
PC plots of FT-IR spectra of DNA show complete discrimination between prostate groups. (A) PC4 (P < 0.01) vs. PC10 (P < 0.01) for the cancer DNA phenotype in the older men (▴; n = 5) and the older men without the phenotype (▵; n = 7). (B) PC7 (P = 0.03) vs. PC9 (P = 0.02) for the cancer DNA phenotype in the older men (▴; n = 5), the older men without the phenotype (▵; n = 7), and the younger men (•; n = 9).
Fig. 3.
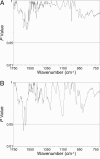
P values resulting from comparisons of FT-IR spectra of DNA from the following prostate tissues show no significant differences (P < 0.05), thus establishing the structural similarity between the groups: (A) tumor (n = 9) vs. the cancer DNA phenotype in the older men (n = 5); and (B) histologically normal tissues surrounding tumors (n = 9) vs. the cancer DNA phenotype in the older men.
Similar articles
- Cancer-related changes in prostate DNA as men age and early identification of metastasis in primary prostate tumors.
Malins DC, Johnson PM, Barker EA, Polissar NL, Wheeler TM, Anderson KM. Malins DC, et al. Proc Natl Acad Sci U S A. 2003 Apr 29;100(9):5401-6. doi: 10.1073/pnas.0931396100. Epub 2003 Apr 17. Proc Natl Acad Sci U S A. 2003. PMID: 12702759 Free PMC article. - Metastatic cancer DNA phenotype identified in normal tissues surrounding metastasizing prostate carcinomas.
Malins DC, Gilman NK, Green VM, Wheeler TM, Barker EA, Vinson MA, Sayeeduddin M, Hellström KE, Anderson KM. Malins DC, et al. Proc Natl Acad Sci U S A. 2004 Aug 3;101(31):11428-31. doi: 10.1073/pnas.0404572101. Epub 2004 Jul 27. Proc Natl Acad Sci U S A. 2004. PMID: 15280533 Free PMC article. - Organ-wide telomeric status in diseased and disease-free prostatic tissues.
Heaphy CM, Fleet TM, Treat EG, Lee SJ, Smith AY, Davis MS, Griffith JK, Fischer EG, Bisoffi M. Heaphy CM, et al. Prostate. 2010 Sep 15;70(13):1471-9. doi: 10.1002/pros.21182. Prostate. 2010. PMID: 20687220 Free PMC article. - Androgen action during prostate carcinogenesis.
Wang D, Tindall DJ. Wang D, et al. Methods Mol Biol. 2011;776:25-44. doi: 10.1007/978-1-61779-243-4_2. Methods Mol Biol. 2011. PMID: 21796518 Review. - Mucinous and secondary tumors of the prostate.
Osunkoya AO. Osunkoya AO. Mod Pathol. 2018 Jan;31(S1):S80-S95. doi: 10.1038/modpathol.2017.132. Mod Pathol. 2018. PMID: 29297488 Review.
Cited by
- Aberrant c-erbB2 expression in cell clusters overlying focally disrupted breast myoepithelial cell layers: a trigger or sign for emergence of more aggressive cell clones?
Zhang X, Hashemi SS, Yousefi M, Ni J, Wang Q, Gao L, Gong P, Gao C, Sheng J, Mason J, Man YG. Zhang X, et al. Int J Biol Sci. 2008 Aug 16;4(5):259-69. doi: 10.7150/ijbs.4.259. Int J Biol Sci. 2008. PMID: 18726004 Free PMC article. - Clinical implications and utility of field cancerization.
Dakubo GD, Jakupciak JP, Birch-Machin MA, Parr RL. Dakubo GD, et al. Cancer Cell Int. 2007 Mar 15;7:2. doi: 10.1186/1475-2867-7-2. Cancer Cell Int. 2007. PMID: 17362521 Free PMC article. - Increased invasiveness and aggressiveness in breast epithelia with cytoplasmic p63 expression.
Hsiao YH, Su YA, Tsai HD, Mason JT, Chou MC, Man YG. Hsiao YH, et al. Int J Biol Sci. 2010 Aug 8;6(5):428-42. doi: 10.7150/ijbs.6.428. Int J Biol Sci. 2010. PMID: 20714441 Free PMC article. - Gene expression profiles associated with advanced pancreatic cancer.
Campagna D, Cope L, Lakkur SS, Henderson C, Laheru D, Iacobuzio-Donahue CA. Campagna D, et al. Int J Clin Exp Pathol. 2008 Jan 1;1(1):32-43. Int J Clin Exp Pathol. 2008. PMID: 18784821 Free PMC article.
References
- Garcia-Closas, M., Hankinson, S. E., Ho, S., Malins, D. C., Polissar, N. L., Schaefer, S. N., Su, Y. & Vinson, M. A. (2000) J. Natl. Cancer Inst. Monogr. 27, 147-156. - PubMed
Publication types
MeSH terms
Substances
LinkOut - more resources
Full Text Sources
Other Literature Sources
Medical


