Tumor necrosis factor promotes Runx2 degradation through up-regulation of Smurf1 and Smurf2 in osteoblasts - PubMed (original) (raw)
Tumor necrosis factor promotes Runx2 degradation through up-regulation of Smurf1 and Smurf2 in osteoblasts
Hiroyuki Kaneki et al. J Biol Chem. 2006.
Abstract
Tumor necrosis factor (TNF) plays an important role in the pathogenesis of inflammatory bone loss through stimulation of osteoclastic bone resorption and inhibition of osteoblastic bone formation. Compared with the well established role of TNF in osteoclastogenesis, mechanisms by which TNF inhibits osteoblast function have not been fully determined. Runx2 is an osteoblast-specific transcription factor whose steady-state protein levels are regulated by proteasomal degradation, mediated by the E3 ubiquitin ligases, Smurf1 and Smurf2. We hypothesized that TNF inhibits osteoblast function through Smurf-mediated Runx2 degradation. We treated C2C12 and 2T3 osteoblast precursor cell lines and primary osteoblasts with TNF and found that TNF, but not interleukin-1, significantly increased Smurf1 and Smurf2 expression. TNF increased the degradation of endogenous or transfected Runx2 protein, which was blocked by treating cells with a proteasomal inhibitor or by infecting cells with small interfering (si)RNA against Smurf1 or Smurf2. TNF inhibited the expression of bone morphogenetic protein and transforming growth factor-beta signaling reporter constructs, and the inhibition of each was blocked by Smurf1 siRNA and Smurf2 siRNA, respectively. Overexpression of Smurf1 and/or Smurf2 siRNAs prevented the inhibitory effect of TNF on Runx2 reporter. Consistent with these in vitro findings, bones from TNF transgenic mice or TNF-injected wild type mice had increased Smurf1 and decreased Runx2 protein levels. We propose that one of the mechanisms by which TNF inhibits bone formation in inflammatory bone disorders is by promoting Runx2 proteasomal degradation through up-regulation of Smurf1 and Smurf2 expression.
Figures
FIGURE 1. Decreased bone volume and osteoblast functions in TNF-Tg mice
A, femur from a 4-month-old TNF-Tg mouse and a wt littermate were fixed and processed. Paraffin-embedded sections were stained with hematoxylin and eosin. Lower bone volume in the metaphysis of the femur (green stars) is present in the TNF-Tg mouse (magnification, ×4). B, the distal femoral trabecular bone volume was measured as described previously (38). The values are the mean ± S.E. of eight or nine mice. *,p < 0.05 versus wt mice. C, bone marrow stromal cells were isolated from 4-month-old TNF-Tg mice and wt littermates and cultured in osteoblast differentiation medium containing 100 _μ_g/ml
l
-ascorbic acid and 5 m
m
_β_-glycerophosphate in the presence or absence of 40 ng/ml BMP-2 for 2 weeks. The cells were fixed, and mineralized bone nodules were identified by vonKossa staining. The area of bone nodules was measured under light microscopy using point counting. The values are the mean ± S.E. of three wells. *,p < 0.05 versus wt cells. The same results were obtained from three pairs of TNF-Tg mice and wt littermates. D, mineralized bone nodules from one representative pair of TNF-Tg mice and wt littermates (magnification, ×2).
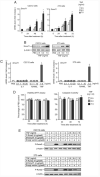
FIGURE 2. TNF increases Smurf1 expression and induces Runx2 degradation
A, C2C12 or 2T3 cells were treated with PBS or TNF (2.5–7.5 ng/ml) for 24, 48, and 72 h. Smurf1 and β-actin mRNA levels were measured by real time RT-PCR. The relative expression level of Smurf1 was normalized to β-actin in the same sample. The -fold increase was calculated as follows: (relative Smurf1 level in TNF-treated sample)/(relative Smurf1 level in PBS-treated sample). The values are the mean ± S.E. of three dishes. *, p < 0.05 versus the PBS-treated group. B, cells were treated with 2.5–7.5 ng/ml TNF for 72 h. Smurf1 and _β_-actin protein levels were examined by Western blot analysis. C, cells were treated with various doses of IL-1 and RANKL and with 7.5 ng/ml TNF for 72 h. The relative expression levels of Smurf1 mRNA were determined by real time RT-PCR, as described in A. The values are the mean ± S.E. of three dishes. *, p < 0.05 versus the PBS-treated group. D, cells were treated with 2.5–7.5 ng/ml TNF for 24, 48, and 72 h. Cell lysates were used for measuring caspase-3 activity or MTT assay. The values are the mean ± S.E. of three dishes. *, p<0.05 versus the PBS-treated group. E, cells were transfected with M-Smurf1 and/or F-Runx2 expression plasmids or empty vector for 24 h and cultured for 72 h in the presence of PBS or TNF (2.5–7.5 ng/ml). F-Runx2 expression was detected by Western blot using anti-FLAG antibody.
FIGURE 3. TNF induces ubiquitination of Runx2 protein
2T3 cells were treated with 7.5 ng/ml TNF for 72 h in the presence or absence of 0.1 mM MG132 for the last 12 h of TNF treatment, and endogenous Runx2 was immunoprecipitated (IP) by anti-Runx2 antibody. Ubiquitinated Runx2 (Ub-Runx2) protein ladders were detected by anti-ubiquitin antibody (upper panel). After stripping the antibody, total un-ubiquitinated Runx2 protein levels were determined by anti-Runx2 antibody (lower panel). MW, molecular mass.
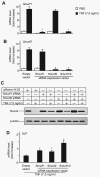
FIGURE 4. Smurf1 or Smurf2 siRNA blocks TNF-induced Runx2 degradation
2T3 cells were infected with retroviral supernatant containing Smurf1 and/or Smurf2 siRNAs or empty vector, then cells were transfected with F-Runx2 expression plasmid (4 μ_g/dish) and treated with 7.5 ng/ml TNF for 72 h. Smurf1 (A) and Smurf2 (B) mRNA levels were measured by real time RT-PCR. The values are the mean ± S.E. of three dishes. The -fold increase was calculated as described in Fig. 2_A. *, p<0.05 versus the empty vector-infected TNF group. C, the expression of F-Runx2 was determined by Western blot analysis using anti-FLAG antibody as described in Fig. 2_E_. D, ALP mRNA expression was assessed by real time RT-PCR. The values are the mean ± S.E. of three dishes. The -fold increase was calculated as described in Fig. 2_A_. *, p<0.05 versus empty vector-infected TNF group.
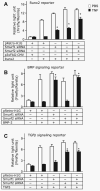
FIGURE 5. TNF targets both BMP and TGF-β signaling pathways in osteoblasts
A, 2T3 cells were infected with retroviral supernatant containing Smurf1 and/or Smurf2 siRNAs or empty vector, then cells were cotransfected with the Runx2 expression vector (Runx2), the empty expression vector (p3×FAG-CMV), and the Runx2 reporter vector (6×OSE2-OC-Luc) for 8 h and then treated with 7.5 ng/ml TNF for 48 h. B and C, 2T3 cells were infected with retroviral supernatant containing Smurf1 and/or Smurf2 siRNA or empty vector, then the BMP-2 and TGF-β signaling reporter constructs, 12×SBE-OC-Luc (B) or p3TP-Lux (C) were transfected into cells for 8 h. The cells were treated with 7.5 ng/ml TNF for 48 h and then stimulated with 50 ng/ml BMP-2 (B) or 2 ng/ml TGF-β (C) for 24 h in the presence of PBS or 10 ng/ml TNF. The values are the mean × S.E. of three dishes. *, p<0.05 versus empty vector-infected TNF group.
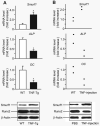
FIGURE 6. TNF increases Smurf1 expression in vivo
A, RNA and protein were extracted directly from the metaphyseal region of 4-month-old TNF-Tg mice and wt littermates. The relative expression levels of Smurf1, ALP, and OC were measured by real time RT-PCR (upper panels), as described in Fig. 2. The values are the mean ± S.E. of four pairs of TNF-Tg and wt mice. *, p < 0.05 versus wt mice. Smurf1 and _β_-actin protein levels were determined by Western blot analysis (lower panels). The data are representative of three pairs of TNF-Tg or wt mice. B, TNF (0.25 _μ_g/injection, three times/day × 3 days, n = 2) or PBS was injected over the calvarial bones of wt mice. RNA and protein were extracted directly from calvarial bones. Expression levels of Smurf1, ALP, and OC mRNA and Smurf1 and _β_-actin protein were examined as described in A. The data show the values of individual mice.
Similar articles
- Ubiquitin ligase Smurf1 mediates tumor necrosis factor-induced systemic bone loss by promoting proteasomal degradation of bone morphogenetic signaling proteins.
Guo R, Yamashita M, Zhang Q, Zhou Q, Chen D, Reynolds DG, Awad HA, Yanoso L, Zhao L, Schwarz EM, Zhang YE, Boyce BF, Xing L. Guo R, et al. J Biol Chem. 2008 Aug 22;283(34):23084-92. doi: 10.1074/jbc.M709848200. Epub 2008 Jun 19. J Biol Chem. 2008. PMID: 18567580 Free PMC article. - Tumor necrosis factor-α enhances the transcription of Smad ubiquitination regulatory factor 1 in an activating protein-1- and Runx2-dependent manner.
Lee HL, Yi T, Baek K, Kwon A, Hwang HR, Qadir AS, Park HJ, Woo KM, Ryoo HM, Kim GS, Baek JH. Lee HL, et al. J Cell Physiol. 2013 May;228(5):1076-86. doi: 10.1002/jcp.24256. J Cell Physiol. 2013. PMID: 23042144 - Smurf1 inhibits osteoblast differentiation and bone formation in vitro and in vivo.
Zhao M, Qiao M, Harris SE, Oyajobi BO, Mundy GR, Chen D. Zhao M, et al. J Biol Chem. 2004 Mar 26;279(13):12854-9. doi: 10.1074/jbc.M313294200. Epub 2003 Dec 29. J Biol Chem. 2004. PMID: 14701828 Free PMC article. - Regulatory mechanisms of osteoblast and osteoclast differentiation.
Katagiri T, Takahashi N. Katagiri T, et al. Oral Dis. 2002 May;8(3):147-59. doi: 10.1034/j.1601-0825.2002.01829.x. Oral Dis. 2002. PMID: 12108759 Review. - Regulatory Roles of E3 Ubiquitin Ligases and Deubiquitinases in Bone.
He H, Wang L, Xian B, Xia Y. He H, et al. Biomolecules. 2025 May 7;15(5):679. doi: 10.3390/biom15050679. Biomolecules. 2025. PMID: 40427572 Free PMC article. Review.
Cited by
- Inflammatory bone loss: pathogenesis and therapeutic intervention.
Redlich K, Smolen JS. Redlich K, et al. Nat Rev Drug Discov. 2012 Mar 1;11(3):234-50. doi: 10.1038/nrd3669. Nat Rev Drug Discov. 2012. PMID: 22378270 Review. - Inhibition of Runx2 signaling by TNF-α in ST2 murine bone marrow stromal cells undergoing osteogenic differentiation.
Ye X, Huang H, Zhao N, Zhang J, Yang P. Ye X, et al. In Vitro Cell Dev Biol Anim. 2016 Dec;52(10):1026-1033. doi: 10.1007/s11626-016-0068-3. Epub 2016 Jul 11. In Vitro Cell Dev Biol Anim. 2016. PMID: 27401008 - Tumor necrosis factor alpha represses bone morphogenetic protein (BMP) signaling by interfering with the DNA binding of Smads through the activation of NF-kappaB.
Yamazaki M, Fukushima H, Shin M, Katagiri T, Doi T, Takahashi T, Jimi E. Yamazaki M, et al. J Biol Chem. 2009 Dec 18;284(51):35987-95. doi: 10.1074/jbc.M109.070540. J Biol Chem. 2009. PMID: 19854828 Free PMC article. - Smurf1 inhibits mesenchymal stem cell proliferation and differentiation into osteoblasts through JunB degradation.
Zhao L, Huang J, Guo R, Wang Y, Chen D, Xing L. Zhao L, et al. J Bone Miner Res. 2010 Jun;25(6):1246-56. doi: 10.1002/jbmr.28. J Bone Miner Res. 2010. PMID: 20200942 Free PMC article. - Ubiquitin-dependent regulation of TGFbeta signaling in cancer.
Izzi L, Attisano L. Izzi L, et al. Neoplasia. 2006 Aug;8(8):677-88. doi: 10.1593/neo.06472. Neoplasia. 2006. PMID: 16925950 Free PMC article. Review.
References
- Goldring SR, Gravallese EM. Curr. Opin. Rheumatol. 2000;12:195–199. - PubMed
- Nair SP, Williams RJ, Henderson B. Rheumatology. 2000;39:821–834. - PubMed
- Canalis E. Endocrinology. 1987;121:1596–1604. - PubMed
- Li YP, Stashenko P. J. Immunol. 1992;148:788–794. - PubMed
Publication types
MeSH terms
Substances
Grants and funding
- AR051189/AR/NIAMS NIH HHS/United States
- R01 AR051189/AR/NIAMS NIH HHS/United States
- R03 AR048920/AR/NIAMS NIH HHS/United States
- AR43510/AR/NIAMS NIH HHS/United States
- R01 AR043510/AR/NIAMS NIH HHS/United States
- R01 AR048697/AR/NIAMS NIH HHS/United States
- AR48697/AR/NIAMS NIH HHS/United States
- ZIA BC011168/ImNIH/Intramural NIH HHS/United States
LinkOut - more resources
Full Text Sources
Other Literature Sources
Molecular Biology Databases


