Comparative analysis of lesion development and intraspinal inflammation in four strains of mice following spinal contusion injury - PubMed (original) (raw)
Comparative Study
. 2006 Feb 1;494(4):578-94.
doi: 10.1002/cne.20827.
Affiliations
- PMID: 16374800
- PMCID: PMC2655318
- DOI: 10.1002/cne.20827
Comparative Study
Comparative analysis of lesion development and intraspinal inflammation in four strains of mice following spinal contusion injury
Kristina A Kigerl et al. J Comp Neurol. 2006.
Abstract
Susceptibility to neuroinflammatory disease is influenced in part by genetics. Recent data indicate that survival of traumatized neurons is strain dependent and influenced by polygenic loci that control resistance/susceptibility to experimental autoimmune encephalomyelitis (EAE), a model of CNS autoimmune disease. Here, we describe patterns of neurodegeneration and intraparenchymal inflammation after traumatic spinal cord injury (SCI) in mice known to exhibit varying degrees of EAE susceptibility [EAE-resistant (r) or EAE-susceptible (s) mice]. Spinal cords from C57BL/6 (EAE-s), C57BL/10 (EAE-r), BALB/c (EAE-r), and B10.PL (EAE-s) mice were prepared for stereological and immunohistochemical analysis at 6 hours or 3, 7, 14, 28, or 42 days following midthoracic (T9) spinal contusion injury. In general, genetic predisposition to EAE predicted the magnitude of intraparenchymal inflammation but not lesion size/length or locomotor recovery. Specifically, microglia/macrophage activation, recruitment of neutrophils and lymphocytes, and de novo synthesis of MHC class II were greatest in C57BL/6 mice and least in BALB/c mice at all times examined. However, lesion volume and axial spread of neurodegeneration were similar in C57BL/6 and BALB/c mice and were significantly greater than in C57BL/10 or B10.PL mice. Strains with marked intraspinal inflammation also developed the most intense lesion fibrosis. Thus, strain-dependent neuroinflammation was observed after SCI, but without a consistent relationship to EAE susceptibility or lesion progression. Only in C57BL/6 mice was the magnitude of intraspinal inflammation predictive of secondary neurodegeneration, functional recovery, or fibrosis.
J. Comp. Neurol. 494:578-594, 2006. (c) 2005 Wiley-Liss, Inc.
Figures
Fig. 1
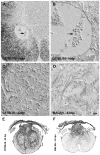
Comparison of C57Bl/6 and BALB/c lesion epicenters 3 days after SCI. Removal of extravasated red blood cells (RBCs) is impaired in BALB/c mice and is associated with an attenuated macrophage response. EC-stained cross-sections from the impact site of a C57BL/6 (A) and BALB/c (B) mouse at 3 dpi reveal large necrotic cavities surrounded by a rim of spared white matter. In BALB/c mice (B,C,E,F), RBC deposits persist at 3 dpi (E; differential interference contrast (DIC) optics). Conversely, RBC deposits are not found in C57BL/6 (D). Immunohistochemical stains for macrophages (Mac-1; F, G;) show fewer activated macrophages at the impact site in BALB/c mice (F) compared to other strains (G; C57BL/6 mouse). Box in B illustrates region shown in high-power in C. Scale = A&B (157 μm); C (20 μm); D–G (15 μm).
Fig. 2
Acute necrotic lesion cavities undergo tissue remodeling and become invested with a fibronectin-rich extracellular matrix. By 14 dpi in all strains, large necrotic lesion cavities were absent. However, small macrophage-filled cysts persisted (arrows in A; higher power in B; shown for C57BL/10 mice; A,B). By 14 dpi in most mice, a densely packed cellular matrix (shown in C,D at 42 dpi) fills necrotic cavities. The magnitude of this response was greatest for C57BL/6 mice (C, E) and least for BALB/c mice (D,F). Note the visible difference in tissue compaction (C,D; DIC optics of EC-stained tissue) and fibronectin staining (E,F) between C57BL/6 and BALB/c mice at 42dpi. Scale = A (55 μm), B–D (14 μm), E,F (110 μm).
Fig. 3
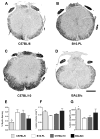
Morphometric analysis of contused spinal cord 42 dpi from C57BL/6 (A), B10.PL (B), C57BL/10 (C), and BALB/c (D) mice. Quantitive analyses of myelin sparing (E), lesion volume (F) and lesion length (G) were determined from EC stained sections as described in Material/Methods. * p<0.05 vs. B10.PL and/or C57BL/10 mice (n=5_–_9 mice/strain). Scale = 200 μm.
Fig. 4
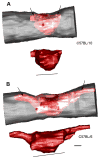
Three-dimensional (3D) reconstructions of contusion lesions from randomly chosen mice with the shortest/smallest (C57BL/10; A) and longest/largest lesions (C57BL/6; B) at 42dpi (gray = outline of spinal cord; red = degenerated/abnormal tissue as defined by light microscopic analysis of EC/cresyl violet-stained tissues). Most of the differences in lesion volume and length between strains can be attributed to longer lesion extensions in the dorsal columns (see Fig. 3 and arrows in Fig. 4). However, larger primary lesions are also visible at the impact site (delimited by line under 3D image of lesion). Scale = 475 μm.
Fig. 5
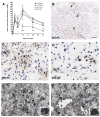
Prolonged intraspinal neutrophil infiltration is found in all mice after SCI (A) but is significantly less in BALB/c mice (n=3–8 mice/time/strain; ***p<0.001; **p<0.01 vs. C57BL/6). Neutrophils were revealed using Ly-6G antibodies [shown in B&C for B10.PL mice (low and high-power, respectively) and in D for BALB/c mice; 14 dpi]. Note the characteristic polymorphonuclear morphology of Ly-6G-stained cells (arrows in C&D; cresyl violet counter-stain). This morphology is also apparent in resin-embedded semi-thin (1μm) sections from C57BL/6 mice at 14 (E) and 28 (F) dpi (neutrophils delineated by arrows in E,F and shown at high-power in inserts). Also, note the numerous lipid-laden macrophages distributed throughout the section that give the large cells surrounding neutrophils a “spotted” appearance. Scale = B (100 μm), C&D (25 μm), E&F (12 μm).
Fig. 6
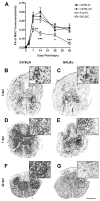
Time-course of CNS macrophage activation is similar between all strains but is dramatically reduced in magnitude in BALB/c mice (A; n=3_–_6/time/strain except 42 dpi C57BL/6 where n=9; *, **, ***p<0.05, 0.01 or 0.001, respectively vs. C57BL/6). Macrophage activation in acutely injured spinal cord (3dpi) is most prevalent within central spinal cord gray matter (shown for C57BL/6 (B) and BALB/c (C) mice). Peak macrophage activation occurs 7–14dpi with large rounded CD11b+ macrophages occupying most of the cross-sectional area at the impact site (only 7dpi shown; D&E). By 42dpi, an intense CNS macrophage response persists in all strains except BALB/c mice [C57BL/6 (F); BALB/c (G)]. Scale = B–G (400 μm), high-power inserts of boxed regions (100 μm).
Fig. 7
Activated microglia delineate boundaries of axonal pathways undergoing Wallerian degeneration in all strains except BALB/c. Quantitative analysis of CNS macrophage activation (see Materials & Methods) within dorsal columns revealed marked macrophage activation in all strains except BALB/c mice (n=6–9/strain; 42 dpi; *** p<0.001 vs. C57BL/6). Low-power images of C57BL/6 (B) and BALB/c (C) mice taken ~ 3.5 mm rostral to the impact site. Adjacent sections stained for myelin (D&E) or anti-CD11b (F&G) reveal the strict delineation of the macrophage response within the gracile fasciculus (wedge-shaped region indicated by dotted lines in EC-stained sections in D,E). Scale = B&C (250 μm), D&E (85 μm), F&G (70 μm).
Fig. 8
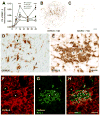
MHC class II expression is increased as a function of time post-injury on microglia/macrophages and “fibrocytes”. MHC class II expression increased during the first week post injury (epicenter sections shown for C57BL/6 and BALB/c mice at 7 dpi; B&C, respectively) peaking 14–42 dpi in all strains but to the greatest extent in C57BL/6 mice (A; n=3_–_6/time/strain except 42 dpi in C57BL/6 mice where n=9; *, ***p<0.05 or 0.001, C57BL/6 vs. all other strains). At 7–14 dpi, most MHC II expression is found on cells with microglial/macrophage morphology (arrows; D). By 28–42 dpi, perivascular MHC class II+ clusters formed within zones of fibrosis in all strains except BALB/c mice (shown for C57BL/6 in E; *=vessel profiles). Confocal microscopic analysis (merged image in H) of CD11b (microglia/macrophages; AlexaFluor 546/red; F) and MHCII labeling (Oregon Green 488; G) shows that most MHC class II+ cell clusters contain few macrophages. Asterisks placed in blood vessel profiles provided for orientation between images. Scale = B,C (250 μm); D&E (20 μm), F–H (40 μm).
Fig. 9
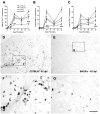
The time-course and phenotype of infiltrating T cells is similar in all strains after SCI (cell counts of anti-CD3 labeled sections; A). However, the magnitude of this response is highest in C57BL/6 mice and lowest in BALB/c mice (A–G). Quantitative analysis of T-cell subsets shows that the CD4:CD8 ratio of infiltrating T-cells is ~ 2:1 at all times post-injury (B,C). Boxed regions in D&E shown at high power in F&G, reveal CD3+ cell morphology at 42 dpi in C57BL/6 or BALB/c mice. Scale = D&E (130 μm), F,G (30 μm).
Similar articles
- Neuronal survival after CNS insult is determined by a genetically encoded autoimmune response.
Kipnis J, Yoles E, Schori H, Hauben E, Shaked I, Schwartz M. Kipnis J, et al. J Neurosci. 2001 Jul 1;21(13):4564-71. doi: 10.1523/JNEUROSCI.21-13-04564.2001. J Neurosci. 2001. PMID: 11425884 Free PMC article. - Genetic susceptibility or resistance to autoimmune encephalomyelitis in MHC congenic mice is associated with differential production of pro- and anti-inflammatory cytokines.
Maron R, Hancock WW, Slavin A, Hattori M, Kuchroo V, Weiner HL. Maron R, et al. Int Immunol. 1999 Sep;11(9):1573-80. doi: 10.1093/intimm/11.9.1573. Int Immunol. 1999. PMID: 10464178 - Cross-species comparisons between pigs and mice reveal conserved sex-specific intraspinal inflammatory responses after spinal cord injury.
Kumari R, Hammers GV, Hammons RH, Stewart AN, MacLean SM, Niedzielko T, Schneider LE, Floyd CL, Gensel JC. Kumari R, et al. J Neuroinflammation. 2025 Jan 23;22(1):16. doi: 10.1186/s12974-025-03338-1. J Neuroinflammation. 2025. PMID: 39849507 Free PMC article. - Comparison of immunopathology and locomotor recovery in C57BL/6, BUB/BnJ, and NOD-SCID mice after contusion spinal cord injury.
Luchetti S, Beck KD, Galvan MD, Silva R, Cummings BJ, Anderson AJ. Luchetti S, et al. J Neurotrauma. 2010 Feb;27(2):411-21. doi: 10.1089/neu.2009.0930. J Neurotrauma. 2010. PMID: 19831737 Free PMC article. - Delayed microglial depletion after spinal cord injury reduces chronic inflammation and neurodegeneration in the brain and improves neurological recovery in male mice.
Li Y, Ritzel RM, Khan N, Cao T, He J, Lei Z, Matyas JJ, Sabirzhanov B, Liu S, Li H, Stoica BA, Loane DJ, Faden AI, Wu J. Li Y, et al. Theranostics. 2020 Sep 14;10(25):11376-11403. doi: 10.7150/thno.49199. eCollection 2020. Theranostics. 2020. PMID: 33052221 Free PMC article.
Cited by
- Inhibition of astroglial NF-κB enhances oligodendrogenesis following spinal cord injury.
Bracchi-Ricard V, Lambertsen KL, Ricard J, Nathanson L, Karmally S, Johnstone J, Ellman DG, Frydel B, McTigue DM, Bethea JR. Bracchi-Ricard V, et al. J Neuroinflammation. 2013 Jul 23;10:92. doi: 10.1186/1742-2094-10-92. J Neuroinflammation. 2013. PMID: 23880092 Free PMC article. - Immune response following traumatic spinal cord injury: Pathophysiology and therapies.
Sterner RC, Sterner RM. Sterner RC, et al. Front Immunol. 2023 Jan 6;13:1084101. doi: 10.3389/fimmu.2022.1084101. eCollection 2022. Front Immunol. 2023. PMID: 36685598 Free PMC article. Review. - Activated microglia contribute to the maintenance of chronic pain after spinal cord injury.
Hains BC, Waxman SG. Hains BC, et al. J Neurosci. 2006 Apr 19;26(16):4308-17. doi: 10.1523/JNEUROSCI.0003-06.2006. J Neurosci. 2006. PMID: 16624951 Free PMC article. - Quantitative evaluation of 3D mouse behaviors and motor function in the open-field after spinal cord injury using markerless motion tracking.
Sheets AL, Lai PL, Fisher LC, Basso DM. Sheets AL, et al. PLoS One. 2013 Sep 18;8(9):e74536. doi: 10.1371/journal.pone.0074536. eCollection 2013. PLoS One. 2013. PMID: 24058586 Free PMC article. - Extracellular matrix regulation of inflammation in the healthy and injured spinal cord.
Gaudet AD, Popovich PG. Gaudet AD, et al. Exp Neurol. 2014 Aug;258:24-34. doi: 10.1016/j.expneurol.2013.11.020. Exp Neurol. 2014. PMID: 25017885 Free PMC article. Review.
References
- Abe R, Donnelly SC, Peng T, Bucala R, Metz CN. Peripheral blood fibrocytes: differentiation pathway and migration to wound sites. J Immunol. 2001;166:7556–7562. - PubMed
- Baecher-Allan CM, Barth RK. PCR analysis of cytokine induction profiles associated with mouse strain variation in susceptibility to pulmonary fibrosis. Reg Immunol. 1993;5:207–217. - PubMed
- Bao F, Chen Y, Dekaban GA, Weaver LC. Early anti-inflammatory treatment reduces lipid peroxidation and protein nitration after spinal cord injury in rats. J Neurochem. 2004;88:1335–1344. - PubMed
- Bartholdi D, Schwab ME. Expression of pro-inflammatory cytokine and chemokine mRNA upon experimental spinal cord injury in mouse: an in situ hybridization study. Eur J Neurosci. 1997;9:1422–1438. - PubMed
Publication types
MeSH terms
Grants and funding
- DE13749/DE/NIDCR NIH HHS/United States
- R01 NS037846/NS/NINDS NIH HHS/United States
- P50 DE013749/DE/NIDCR NIH HHS/United States
- NS37846/NS/NINDS NIH HHS/United States
- R01 NS047175/NS/NINDS NIH HHS/United States
- NS47175/NS/NINDS NIH HHS/United States
LinkOut - more resources
Full Text Sources
Medical
Research Materials

