Imaging response inhibition in a stop-signal task: neural correlates independent of signal monitoring and post-response processing - PubMed (original) (raw)
Comparative Study
Imaging response inhibition in a stop-signal task: neural correlates independent of signal monitoring and post-response processing
Chiang-shan Ray Li et al. J Neurosci. 2006.
Abstract
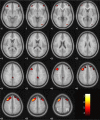
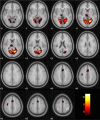
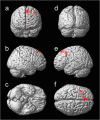
Execution of higher cortical functions requires inhibitory control to restrain habitual responses and meet changing task demands. We used functional magnetic resonance imaging to show the neural correlates of response inhibition during a stop-signal task. The task has a frequent "go" stimulus to set up a pre-potent response tendency and a less frequent "stop" signal for subjects to withhold their response. We contrasted brain activation between successful and failed inhibition for individual subjects and compared groups of subjects with short and long stop-signal reaction times. The two groups of subjects did not differ in their inhibition failure rates or the extent of signal monitoring, error monitoring, or task-associated frustration ratings. The results showed that short stop-signal reaction time or more efficient response inhibition was associated with greater activation in the superior medial and precentral frontal cortices. Moreover, activation of these inhibitory motor areas correlated negatively with stop-signal reaction time. These brain regions may represent the neural substrata of response inhibition independent of other cognitive and affective functions.
Figures
Figure 1.
Brain regions showing more activation in successful compared with failed inhibitions. BOLD contrasts are superimposed on a T1 structural image in axial sections from z = –10 to z = 60. The adjacent sections are 5 mm apart. The color bar represents voxel T value. L, Left; R, right.
Figure 2.
Brain regions showing more activation in failed compared with successful inhibitions. BOLD contrasts are superimposed on a T1 structural image in axial sections from z = –10 to z = 60. The adjacent sections are 5 mm apart. The color bar represents voxel T value. L, Left; R, right.
Figure 3.
Brain regions showing greater activation in the short compared with long SSRT group, rendered on a single-subject three-dimensional brain. The front (a), right (b), bottom (c), back (d), left (e), and top (f) of the brain are shown. The results were thresholded at p = 0.001, uncorrected and 10 voxels.
Figure 4.
Activation of the IMAs demonstrated a significant negative correlation with stop-signal processing time (SSPT; a), but not with EM (b), across all subjects. Activation in the anterior cingulate (antCing) did not correlate with SSPT (c) or EM (d). Each data point represents one subject.
Similar articles
- Gender differences in the neural correlates of response inhibition during a stop signal task.
Li CS, Huang C, Constable RT, Sinha R. Li CS, et al. Neuroimage. 2006 Oct 1;32(4):1918-29. doi: 10.1016/j.neuroimage.2006.05.017. Epub 2006 Jun 27. Neuroimage. 2006. PMID: 16806976 - Independent component analysis of functional networks for response inhibition: Inter-subject variation in stop signal reaction time.
Zhang S, Tsai SJ, Hu S, Xu J, Chao HH, Calhoun VD, Li CS. Zhang S, et al. Hum Brain Mapp. 2015 Sep;36(9):3289-302. doi: 10.1002/hbm.22819. Epub 2015 Jun 18. Hum Brain Mapp. 2015. PMID: 26089095 Free PMC article. - Neural processes of preparatory control for stop signal inhibition.
Hu S, Li CS. Hu S, et al. Hum Brain Mapp. 2012 Dec;33(12):2785-96. doi: 10.1002/hbm.21399. Epub 2011 Oct 5. Hum Brain Mapp. 2012. PMID: 21976392 Free PMC article. - The effect of task complexity on the neural network for response inhibition: An ALE meta-analysis.
Aziz-Safaie T, Müller VI, Langner R, Eickhoff SB, Cieslik EC. Aziz-Safaie T, et al. Neurosci Biobehav Rev. 2024 Mar;158:105544. doi: 10.1016/j.neubiorev.2024.105544. Epub 2024 Jan 12. Neurosci Biobehav Rev. 2024. PMID: 38220034 Review. - Partial response electromyography as a marker of action stopping.
Raud L, Thunberg C, Huster RJ. Raud L, et al. Elife. 2022 May 26;11:e70332. doi: 10.7554/eLife.70332. Elife. 2022. PMID: 35617120 Free PMC article. Review.
Cited by
- Proactive and reactive control by the medial frontal cortex.
Stuphorn V, Emeric EE. Stuphorn V, et al. Front Neuroeng. 2012 Jun 19;5:9. doi: 10.3389/fneng.2012.00009. eCollection 2012. Front Neuroeng. 2012. PMID: 22723779 Free PMC article. - Strength in cognitive self-regulation.
Barutchu A, Carter O, Hester R, Levy N. Barutchu A, et al. Front Psychol. 2013 Apr 11;4:174. doi: 10.3389/fpsyg.2013.00174. eCollection 2013. Front Psychol. 2013. PMID: 23596430 Free PMC article. - Inhibitory behavioral control: A stochastic dynamic causal modeling study comparing cocaine dependent subjects and controls.
Ma L, Steinberg JL, Cunningham KA, Lane SD, Bjork JM, Neelakantan H, Price AE, Narayana PA, Kosten TR, Bechara A, Moeller FG. Ma L, et al. Neuroimage Clin. 2015 Mar 24;7:837-47. doi: 10.1016/j.nicl.2015.03.015. eCollection 2015. Neuroimage Clin. 2015. PMID: 26082893 Free PMC article. - Biological markers of the effects of intravenous methylphenidate on improving inhibitory control in cocaine-dependent patients.
Li CS, Morgan PT, Matuskey D, Abdelghany O, Luo X, Chang JL, Rounsaville BJ, Ding YS, Malison RT. Li CS, et al. Proc Natl Acad Sci U S A. 2010 Aug 10;107(32):14455-9. doi: 10.1073/pnas.1002467107. Epub 2010 Jul 26. Proc Natl Acad Sci U S A. 2010. PMID: 20660731 Free PMC article. - Reward improves response inhibition by enhancing attentional capture.
Wang Y, Braver TS, Yin S, Hu X, Wang X, Chen A. Wang Y, et al. Soc Cogn Affect Neurosci. 2019 Jan 4;14(1):35-45. doi: 10.1093/scan/nsy111. Soc Cogn Affect Neurosci. 2019. PMID: 30535116 Free PMC article.
References
- Amador N, Fried I (2004) Single-neuron activity in the human supplementary motor area underlying preparation for action. J Neurosurg 100: 250–259. - PubMed
- Aron AR, Poldrack RA (2005) The cognitive neuroscience of response inhibition: relevance for genetic research in attention-deficit/hyperactivity disorder. Biol Psychiatry 57: 1285–1292. - PubMed
- Aron AR, Fletcher PC, Bullmore ET, Sahakian BJ, Robbins TW (2003) Stop-signal inhibition disrupted by damage to right inferior frontal gyrus in humans. Nat Neurosci 6: 115–116. - PubMed
- Ball T, Schreiber A, Feige B, Wagner M, Lucking CH, Kristeva-Feige R (1999) The role of higher-order motor areas in voluntary movement as revealed by high-resolution EEG and fMRI. NeuroImage 10: 682–694. - PubMed
Publication types
MeSH terms
Grants and funding
- K12-DA14038/DA/NIDA NIH HHS/United States
- K12 DA014038/DA/NIDA NIH HHS/United States
- P50 DA016556/DA/NIDA NIH HHS/United States
- K02-DA17232/DA/NIDA NIH HHS/United States
- K02 DA017232/DA/NIDA NIH HHS/United States
- P50-DA16556/DA/NIDA NIH HHS/United States
LinkOut - more resources
Full Text Sources


