Identification of wake-active dopaminergic neurons in the ventral periaqueductal gray matter - PubMed (original) (raw)
Comparative Study
Identification of wake-active dopaminergic neurons in the ventral periaqueductal gray matter
Jun Lu et al. J Neurosci. 2006.
Abstract
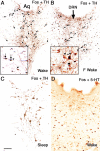
Recent evidence suggests that dopamine plays an important role in arousal, but the location of the dopaminergic neurons that may regulate arousal remains unclear. It is sometimes assumed that the dopaminergic neurons in the ventral tegmental area that project to the prefrontal cortex and striatum may regulate the state of arousal; however, the firing of these dopaminergic neurons does not correlate with overall levels of behavioral wakefulness. We identified wake-active dopaminergic neurons by combining immunohistochemical staining for Fos and tyrosine hydroxylase (TH) in awake and sleeping rats. Approximately 50% of the TH-immunoreactive (TH-ir) cells in the ventral periaqueductal gray matter (vPAG) expressed Fos protein during natural wakefulness or wakefulness induced by environmental stimulation, but none expressed Fos during sleep. Fos immunoreactivity was not seen in the substantia nigra TH-immunoreactive cells in either condition. Injections of 6-hydroxydopamine into the vPAG, which killed 55-65% of wake-active TH-ir cells but did not injure nearby serotoninergic cells, increased total daily sleep by approximately 20%. By combining retrograde and anterograde tracing, we showed that these wake-active dopaminergic cells have extensive reciprocal connections with the sleep-wake regulatory system. The vPAG dopaminergic cells may provide the long-sought ascending dopaminergic waking influence. In addition, their close relationship with the dorsal raphe nucleus will require reassessment of previous studies of the role of the dorsal raphe nucleus in sleep, because many of those experiments may have been confounded by the then-unrecognized presence of intermingled wake-active dopaminergic neurons.
Figures
Figure 1.
Dopaminergic but not serotoninergic neurons in the vPAG contain Fos protein during wakefulness but not sleep. Immunohistochemical dual labeling of TH (brown) and Fos (black) is shown in animals that are spontaneously awake (A), kept awake by 2 h of environmental stimulation (B), and are spontaneously asleep (C). Fos-positive TH-ir neurons were seen only during wakefulness (arrows). In contrast, no double-labeled neurons were seen in immunohistochemical dual-labeling of serotonin (5-HT; brown) and Fos (black) in a spontaneously awake rat (D). Aq, Cerebral aqueduct; F wake, forced wakefulness. Scale bar: (in C) A, B, 200 μm; C, D, 100 μm. Arrows point to double-labeled neurons; arrowheads mark single-labeled neurons. An asterisk (*) marks the reference location in the inset box.
Figure 2.
Dopamine (TH-immunoreactive) but not serotonin (5-HT-immunoreactive) neurons in the vPAG are depleted by 6-hydroxydopamine. Dual staining of the same tissue section for TH-ir (A) and 5-HT-ir (B) neurons in the DRN indicates that they are entirely separate populations (inset in A shows higher magnification in merged image). An asterisk (*) marks the identical location in A and in the inset. After 6-hydroxydopamine lesions, few TH-ir cells remained (C), but serotoninergic neurons were not affected (D). Scale bar: (in C) A, B, 100μm; C, D, 250 μm.
Figure 3.
Colocalization of AADC (red) and TH (green) in the vPAG. Nearly all of the TH-ir neurons contained AADC (visualized as yellow color over green neurons; small white arrows); a rare TH-ir cell that did not contain AADC is indicated by the large white arrow. The AADC-ir neurons that were not TH-ir (arrowhead; red cells) are presumably serotoninergic. Scale bar, 100 μm.
Figure 4.
Loss of dopaminergic neurons in the vPAG causes an increase in sleep time. A, The loss of TH-ir neurons in the vPAG after 6-hydroxydopamine lesions (white bars) caused increased sleep compared with control animals (black bars) during both the light and the dark cycle. **p < 0.01. B, The loss of TH-ir neurons in the vPAG correlated closely with the amount of sleep increase. Data are represented as mean ± SEM.
Figure 5.
Anterograde tracer BD (black color) injected into the vPAG labels axons projecting to the medial prefrontal cortex (MPFC; A), the intralaminar thalamus (Th; B), the orexin-ir (brown) neurons in the perifornical field (PeriF; C), and the LC (D). Arrows in the inset in C point to appositions onto orexin-ir cell bodies. Scale bar: (in D) A–D, 250 μm; inset, 100 μm.
Figure 6.
Connections between the dopaminergic cells in the vPAG and cholinergic cells in the basal forebrain and the laterodorsal tegmental nucleus. After BD was injected into the vPAG (A; injection site), anterogradely labeled terminals apposed the ChAT-ir cells (brown) in the laterodorsal tegmental nucleus (B) and the substantia innominata (C; arrow points to a cell with multiple appositions, seen in the inset at higher magnification). CTB (green) injected into the vPAG was retrogradely transported to ChAT-ir cells (red) in the laterodorsal tegmental nucleus (D). Arrows point to doubled-labeled cells (yellow). Scale bar: (in C) A, 200 μm; B–D, 100 μm.
Figure 7.
Reciprocal connections between the wake-active dopaminergic cells in the vPAG and the sleep-active neurons in the VLPO. After CTB and BD together were injected into the vPAG, some CTB-labeled (brown) cells in the VLPO were also Fos-ir (black) in a sleeping rat (A; box is enlarged in B where the arrows indicate CTB–Fos double-labeled cells and the arrowheads show CTB single-labeled neurons). After an injection of both BD and CTB into the vPAG (C) in a sleeping rat, anterogradely labeled (black) terminals were apposed to double-labeled cells containing both CTB (brown cytoplasm) and Fos (black nucleus) in the VLPO (arrows). After an injection of anterograde tracer PHA-L into the VLPO (D), labeled terminals (black) formed appositions with the TH-ir cells in the vPAG (brown) (arrows indicate appositions). These results, together with Figure 8, D and _D_′, indicate a reciprocal connection of the dopaminergic cells in the vPAG and sleep-active neurons in the VLPO. Scale bar: (in C) A, 200 μm; B, 100 μm; C,50 μm; D,25 μm.
Figure 8.
Retrograde labeling of vPAG dopaminergic neurons after injections of CTB into axonal targets. Double labeling of retrograde tracer CTB (first panel in each pair) and TH immunoreactivity (second panel in each pair) in cells in the vPAG after CTB injection in the medial prefrontal cortex (**A, A′), the midline paraventricular thalamus (B, B′), the intralaminar thalamus (C, C′), the VLPO (D, D′), the perifornical area (E, E′), the substantia innominata (F, F′), the LDT (G, G′), and the locus ceruleus (H, H**′). Arrows point to double-labeled cells. Scale bar: (in **E**′) **A–H**′, 100 μm.
Figure 9.
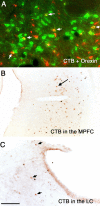
Sources of afferents to the vPAG. CTB injected into the vPAG retrogradely labels neurons (red) in the orexin-ir field (green) in the lateral hypothalamus. Arrows point to double-labeled neurons (yellow). After a similar injection, retrogradely labeled neurons (brown) are seen in the medial prefrontal cortex (B) and in the LC (C). Black fos staining is seen in both B and C in this sleeping animal. MPFC, Medial prefrontal cortex. Scale bar: (in C) A, 100 μm; B, C, 250 μm.
Figure 10.
Appositions of labeled afferents (black) onto the vPAG dopaminergic neurons (brown). Afferents are shown from orexin-ir neurons (A), the locus ceruleus (B), the medial prefrontal cortex (C), and the LDT (D). Arrows indicate terminal appositions with TH-ir cell bodies and dendrites. Scale bar: (in B) A–D,25 μm.
Similar articles
- Adenosine A2A Receptors Link Astrocytic α1-Adrenergic Signaling to Wake-Promoting Dopamine Neurons.
Petersen N, McCann KE, Stavarache MA, Kim LY, Weinshenker D, Winder DG. Petersen N, et al. Biol Psychiatry. 2025 May 1;97(9):915-928. doi: 10.1016/j.biopsych.2024.09.030. Epub 2024 Oct 16. Biol Psychiatry. 2025. PMID: 39419462 - The roles of dopamine and serotonin, and of their receptors, in regulating sleep and waking.
Monti JM, Jantos H. Monti JM, et al. Prog Brain Res. 2008;172:625-46. doi: 10.1016/S0079-6123(08)00929-1. Prog Brain Res. 2008. PMID: 18772053 Review. - Noradrenergic Transmission at Alpha1-Adrenergic Receptors in the Ventral Periaqueductal Gray Modulates Arousal.
Porter-Stransky KA, Centanni SW, Karne SL, Odil LM, Fekir S, Wong JC, Jerome C, Mitchell HA, Escayg A, Pedersen NP, Winder DG, Mitrano DA, Weinshenker D. Porter-Stransky KA, et al. Biol Psychiatry. 2019 Feb 1;85(3):237-247. doi: 10.1016/j.biopsych.2018.07.027. Epub 2018 Aug 17. Biol Psychiatry. 2019. PMID: 30269865 Free PMC article. - [Neurochemical mechanisms of sleep regulation].
[No authors listed] [No authors listed] Glas Srp Akad Nauka Med. 2009;(50):97-109. Glas Srp Akad Nauka Med. 2009. PMID: 20666118 Review. Serbian.
Cited by
- The role of the brainstem in sleep disturbances and chronic pain of Gulf War and Iraq/Afghanistan veterans.
Zhang Y, Moore M, Jennings JS, Clark JD, Bayley PJ, Ashford JW, Furst AJ. Zhang Y, et al. Front Mol Neurosci. 2024 Jan 8;16:1266408. doi: 10.3389/fnmol.2023.1266408. eCollection 2023. Front Mol Neurosci. 2024. PMID: 38260809 Free PMC article. - Nigrostriatal and mesolimbic control of sleep-wake behavior in rat.
Qiu MH, Zhong ZG, Chen MC, Lu J. Qiu MH, et al. Brain Struct Funct. 2019 Sep;224(7):2525-2535. doi: 10.1007/s00429-019-01921-w. Epub 2019 Jul 19. Brain Struct Funct. 2019. PMID: 31324969 Free PMC article. - To sleep or not to sleep - Effects on memory in normal aging and disease.
Kroeger D, Vetrivelan R. Kroeger D, et al. Aging Brain. 2023 Jan 30;3:100068. doi: 10.1016/j.nbas.2023.100068. eCollection 2023. Aging Brain. 2023. PMID: 36911260 Free PMC article. - The distribution and morphological characteristics of catecholaminergic cells in the diencephalon and midbrain of the bottlenose dolphin (Tursiops truncatus).
Manger PR, Fuxe K, Ridgway SH, Siegel JM. Manger PR, et al. Brain Behav Evol. 2004;64(1):42-60. doi: 10.1159/000077542. Epub 2004 Mar 26. Brain Behav Evol. 2004. PMID: 15051966 Free PMC article. - In vivo structural connectome of arousal and motor brainstem nuclei by 7 Tesla and 3 Tesla MRI.
García-Gomar MG, Singh K, Cauzzo S, Bianciardi M. García-Gomar MG, et al. Hum Brain Mapp. 2022 Oct 1;43(14):4397-4421. doi: 10.1002/hbm.25962. Epub 2022 May 28. Hum Brain Mapp. 2022. PMID: 35633277 Free PMC article.
References
- Abercrombie M (1946) Estimation of nuclear population from microtome sections. Anat Rec 94: 239–247. - PubMed
- Arnulf I, Konofal E, Merino-Andreu M, Houeto JL, Mesnage V, Welter ML, Lacomblez L, Golmard JL, Derenne JP, Agid Y (2002) Parkinson's disease and sleepiness: an integral part of PD. Neurology 58: 1019–1024. - PubMed
- Arrigoni E, Lu J, Chamberlin NL, Saper CB (2003) Dopamine induces excitation of the basal forebrain cholinergic neurons. APSS Abstr 1032.A.
- Arsenault MY, Parent A, Seguela P, Descarries L (1988) Distribution and morphological characteristics of dopamine-immunoreactive neurons in the midbrain of the squirrel monkey (Saimiri sciureus). J Comp Neurol 267: 489–506. - PubMed
Publication types
MeSH terms
Substances
Grants and funding
- P50 HL060292/HL/NHLBI NIH HHS/United States
- AG09975/AG/NIA NIH HHS/United States
- MHS051609/MH/NIMH NIH HHS/United States
- MH55772/MH/NIMH NIH HHS/United States
- R01 MH055772/MH/NIMH NIH HHS/United States
- HL60292/HL/NHLBI NIH HHS/United States
- P01 AG009975/AG/NIA NIH HHS/United States
LinkOut - more resources
Full Text Sources
Miscellaneous


