Intratumoral CD4+CD25+ regulatory T-cell-mediated suppression of infiltrating CD4+ T cells in B-cell non-Hodgkin lymphoma - PubMed (original) (raw)
Intratumoral CD4+CD25+ regulatory T-cell-mediated suppression of infiltrating CD4+ T cells in B-cell non-Hodgkin lymphoma
Zhi-Zhang Yang et al. Blood. 2006.
Abstract
Most non-Hodgkin lymphomas (NHLs) are of B-cell origin, but the tumor tissue can be variably infiltrated with T cells. In the present study, we have identified a subset of CD4(+)CD25(+) T cells with high levels of CTLA-4 and Foxp3 (intratumoral T(reg) cells) that are overrepresented in biopsy specimens of B-cell NHL (median of 17% in lymphoma biopsies, 12% in inflammatory tonsil, and 6% in tumor-free lymph nodes; P = .001). We found that these CD4(+)CD25(+) T cells suppressed the proliferation and cytokine (IFN-gamma and IL-4) production of infiltrating CD4(+)CD25(-) T cells in response to PHA stimulation. PD-1 was found to be constitutively and exclusively expressed on a subset of infiltrating CD4(+)CD25(-) T cells, and B7-H1 could be induced on intratumoral CD4(+)CD25(+) T cells in B-cell NHL. Anti-B7-H1 antibody or PD-1 fusion protein partly restored the proliferation of infiltrating CD4(+)CD25(-) T cells when cocultured with intratumoral T(reg) cells. Finally, we found that CCL22 secreted by lymphoma B cells is involved in the chemotaxis and migration of intratumoral T(reg) cells that express CCR4, but not CCR8. Taken together, our results suggest that T(reg) cells are highly represented in the area of B-cell NHL and that malignant B cells are involved in the recruitment of these cells into the area of lymphoma.
Figures
Figure 1.
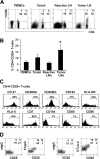
Antigen expression on CD4+CD25+ T cells from biopsy specimens of patients with B-cell NHL. (A) Dot plots showing CD25 expression on CD4+ T cells in freshly isolated cell suspensions from the tissue types indicated. (B) Frequency (mean ± SD) of CD4+CD25+ among normal peripheral blood mononuclear cells (PBMCs) (n = 6), cells from inflammatory tonsils (n = 6), and benign/reactive LNs (n = 6). *P < .001, compared with benign/reactive LNs. (C) The phenotypic analysis of CD4+CD25+ T cells in B-cell NHL. The line was drawn based on the isotype control. The set of histograms is a representative of 6 samples. (D) Dot plots showing intracellular staining of Foxp3 or CTLA-4 as well as their corresponding isotype control in CD3+ CD4+CD25+/- T cells. Patient sample nos. 1 to 4, nos. 6 to 11, and no. 24 were used in these experiments.
Figure 2.
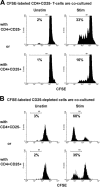
Intratumoral Treg cells suppressed autologous infiltrating CD4+CD25- T-cell proliferation. Isolated CD4+CD25- T cells (A) or CD25-depleted cell suspensions (B) from biopsy specimens of B-cell NHL were labeled with CFSE and cocultured with either CD4+CD25- T cells or CD4+CD25+ T cells in the presence or absence of PHA for 5 days. CFSEdim cells were measured as a percentage of the proliferated cells. The histogram shown is representative of 7 and 3 samples for panels B and C, respectively. Patient sample nos. 7 to 9 and nos. 20 to 23 were used in these experiments.
Figure 3.
CD4+CD25+ T cells from B-cell NHL inhibit cytokine production of infiltrating CD4+CD25- T cells. (A) A representative ELISPOT image of IFN-γ and IL-4 secretion by an unsorted cell suspension and by CD4+ T cells isolated from biopsy specimens of B-cell NHL. (B) Bar graph showing the average number (± SE; n = 6) of IFN-γ and IL-4 spot-forming cells (SFCs) produced by 5 × 10⁵ unsorted, CD4+ or non-CD4+ cells on PHA stimulation. (C) IFN-γ and IL-4 production by CD4+CD25- T cells determined by intracellular staining. IFN-γ- or IL-4-positive cells were determined by gating on the corresponding isotype control. (D) Bar graph showing the average number (± SE; n = 6) of IFN-γ and IL-4 SFCs produced by 5 × 10⁵ total CD4+CD25- T cells incubated with or without CD4+CD25+ T cells on PHA stimulation. Significantly greater IFN-γ secretion (*P < .05) and IL-4 secretion (#P < .01) was seen when compared with cells incubated in the presence of Treg cells. Patient sample nos. 5 to 10 were used in these experiments.
Figure 4.
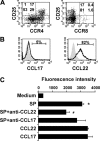
The interaction between CCL22 and CCR4 is involved in the migration of CD4+CD25+ T cells to tumor sites of B-cell NHL. (A) Dot plots showing the expression of CCR4 and CCR8 on CD4+ T cells from biopsy specimens of B-cell NHL (n = 6). (B) Histograms showing intracellular expression of CCL17 and CCL22 in CD20+ lymphoma B cells from biopsy specimens of B-cell NHL (n = 6). The shaded histogram represents the isotype control staining, and the open histogram represents the CCL17 or CCL22 staining. (C) The bar graph showing CD4+CD25+ T-cell migration in response to supernatant of lymphoma B cells (SP). CD4+CD25+ T cells were labeled with calcein AM, and the fluorescence intensity of migrated cells was measured by fluorescent plate reader. Results are the mean ± SD, n = 6, *P < .01, compared with media alone; #P < .05, compared with supernatant. Patient sample nos. 3, 10, 11, 16, 17, and 20 to 23 were used in these experiments.
Figure 5.
The interaction between PD-1 and B7-H1 is involved in intratumoral Treg cell-mediated inhibition of CD4+CD25+ T cells in B-cell NHL. (A) Dot plots showing the expression of B7-H1 and PD-1 on tumor-infiltrating CD4+CD25+/- T cells freshly isolated from B-cell NHL (n = 6). (B) Dot plots showing the expression of B7-H1 on resting (middle) or PHA-activated (right) CD4+CD25+ T cells (n = 3). (C) Histograms showing the effect of the interaction between B7-H1 and PD-1 on intratumoral Treg cell-mediated suppression of infiltrating CD4+CD25- T cells in B-cell NHL. CFSE-labeled CD4+CD25- T cells were cocultured either with CD4+CD25- or CD4+CD25+ T cells in the presence or absence of PHA stimulation for 5 days. Cells in the coculture system were treated with an anti-B7-H1 antibody or PD-1 fusion protein as well as their corresponding controls. The histogram is a representative of 7 samples using the B7-H1 antibody, and of 5 samples using PD-1 Fc. Patient sample no. 11, nos. 15 to 18, and nos. 20 to 23 were used in these experiments.
Similar articles
- CD70+ non-Hodgkin lymphoma B cells induce Foxp3 expression and regulatory function in intratumoral CD4+CD25 T cells.
Yang ZZ, Novak AJ, Ziesmer SC, Witzig TE, Ansell SM. Yang ZZ, et al. Blood. 2007 Oct 1;110(7):2537-44. doi: 10.1182/blood-2007-03-082578. Epub 2007 Jul 5. Blood. 2007. PMID: 17615291 Free PMC article. - Prevalence of regulatory T cells is increased in peripheral blood and tumor microenvironment of patients with pancreas or breast adenocarcinoma.
Liyanage UK, Moore TT, Joo HG, Tanaka Y, Herrmann V, Doherty G, Drebin JA, Strasberg SM, Eberlein TJ, Goedegebuure PS, Linehan DC. Liyanage UK, et al. J Immunol. 2002 Sep 1;169(5):2756-61. doi: 10.4049/jimmunol.169.5.2756. J Immunol. 2002. PMID: 12193750 - Attenuation of CD8(+) T-cell function by CD4(+)CD25(+) regulatory T cells in B-cell non-Hodgkin's lymphoma.
Yang ZZ, Novak AJ, Ziesmer SC, Witzig TE, Ansell SM. Yang ZZ, et al. Cancer Res. 2006 Oct 15;66(20):10145-52. doi: 10.1158/0008-5472.CAN-06-1822. Cancer Res. 2006. PMID: 17047079 Free PMC article. - Tumor-infiltrating T lymphocytes: friends or foes?
Yu P, Fu YX. Yu P, et al. Lab Invest. 2006 Mar;86(3):231-45. doi: 10.1038/labinvest.3700389. Lab Invest. 2006. PMID: 16446705 Review. - Functional and Phenotypic Plasticity of CD4(+) T Cell Subsets.
Caza T, Landas S. Caza T, et al. Biomed Res Int. 2015;2015:521957. doi: 10.1155/2015/521957. Epub 2015 Oct 25. Biomed Res Int. 2015. PMID: 26583116 Free PMC article. Review.
Cited by
- Selective inhibition of TGF-β1 produced by GARP-expressing Tregs overcomes resistance to PD-1/PD-L1 blockade in cancer.
de Streel G, Bertrand C, Chalon N, Liénart S, Bricard O, Lecomte S, Devreux J, Gaignage M, De Boeck G, Mariën L, Van De Walle I, van der Woning B, Saunders M, de Haard H, Vermeersch E, Maes W, Deckmyn H, Coulie PG, van Baren N, Lucas S. de Streel G, et al. Nat Commun. 2020 Sep 11;11(1):4545. doi: 10.1038/s41467-020-17811-3. Nat Commun. 2020. PMID: 32917858 Free PMC article. - Lenalidomide in diffuse large B-cell lymphoma.
Thieblemont C, Delfau-Larue MH, Coiffier B. Thieblemont C, et al. Adv Hematol. 2012;2012:861060. doi: 10.1155/2012/861060. Epub 2012 Nov 20. Adv Hematol. 2012. PMID: 23251161 Free PMC article. - Cross talk between follicular Th cells and tumor cells in human follicular lymphoma promotes immune evasion in the tumor microenvironment.
Rawal S, Chu F, Zhang M, Park HJ, Nattamai D, Kannan S, Sharma R, Delgado D, Chou T, Lin HY, Baladandayuthapani V, Luong A, Vega F, Fowler N, Dong C, Davis RE, Neelapu SS. Rawal S, et al. J Immunol. 2013 Jun 15;190(12):6681-93. doi: 10.4049/jimmunol.1201363. Epub 2013 May 17. J Immunol. 2013. PMID: 23686488 Free PMC article. - Novel treatment approaches and future perspectives in follicular lymphoma.
Sutamtewagul G, Link BK. Sutamtewagul G, et al. Ther Adv Hematol. 2019 Jan 11;10:2040620718820510. doi: 10.1177/2040620718820510. eCollection 2019. Ther Adv Hematol. 2019. PMID: 30719267 Free PMC article. Review. - Apoptosis of CD4(+)CD25(high) T cells in response to Sirolimus requires activation of T cell receptor and is modulated by IL-2.
Molhoek KR, McSkimming CC, Olson WC, Brautigan DL, Slingluff CL Jr. Molhoek KR, et al. Cancer Immunol Immunother. 2009 Jun;58(6):867-76. doi: 10.1007/s00262-008-0602-6. Epub 2008 Oct 8. Cancer Immunol Immunother. 2009. PMID: 18841360 Free PMC article.
References
- de Jong D. Molecular pathogenesis of follicular lymphoma: a cross talk of genetic and immunologic factors. J Clin Oncol. 2005;23: 6358-6363. - PubMed
- Drach J, Seidl S, Kaufmann H. Treatment of mantle cell lymphoma: targeting the microenvironment. Expert Rev Anticancer Ther. 2005;5: 477-485. - PubMed
- Dave SS, Wright G, Tan B, et al. Prediction of survival in follicular lymphoma based on molecular features of tumor-infiltrating immune cells. N Engl J Med. 2004;351: 2159-2169. - PubMed
- Ansell SM, Stenson M, Habermann TM, Jelinek DF, Witzig TE. Cd4+ T-cell immune response to large B-cell non-Hodgkin's lymphoma predicts patient outcome. J Clin Oncol. 2001;19: 720-726. - PubMed
- Baecher-Allan C, Viglietta V, Hafler DA. Human CD4+CD25+ regulatory T cells. Semin Immunol. 2004;16: 89-98. - PubMed
Publication types
MeSH terms
Substances
LinkOut - more resources
Full Text Sources
Other Literature Sources
Research Materials


