Recent behavioral history modifies coupling between cell activity and Arc gene transcription in hippocampal CA1 neurons - PubMed (original) (raw)
Recent behavioral history modifies coupling between cell activity and Arc gene transcription in hippocampal CA1 neurons
John F Guzowski et al. Proc Natl Acad Sci U S A. 2006.
Abstract
The ability of neurons to alter their transcriptional programs in response to synaptic input is of fundamental importance to the neuroplastic mechanisms underlying learning and memory. Because of technical limitations of conventional gene detection methods, the current view of activity-dependent neural transcription derives from experiments in which neurons are assumed quiescent until a signaling stimulus is given. The present study was designed to move beyond this static model by examining how earlier episodes of neural activity influence transcription of the immediate-early gene Arc. Using a sensitive FISH method that detects primary transcript at genomic alleles, the proportion of hippocampal CA1 neurons that activate transcription of Arc RNA was constant at approximately 40% in response to both a single novel exploration session and daily sessions repeated over 9 days. This proportion is similar to the percentage of active neurons defined electrophysiologically. However, this close correspondence was disrupted in rats exposed briefly, but repeatedly, to the same environment within a single day. Arc transcription in CA1 neurons declined dramatically after as few as four 5-min sessions, despite stable electrophysiological activity during all sessions. Additional experiments indicate that the decrement in Arc transcription occurred at the cellular, rather than synaptic level, and was not simply linked to habituation to novelty. Thus, the neural genomic response is governed by recent, but not remote, cell firing history in the behaving animal. This state-dependence of neuronal transcriptional coupling provides a mechanism of metaplasticity and may regulate capacity for synaptic modification in neural networks.
Figures
Fig. 1.
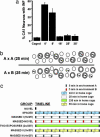
Nuclear Arc FISH signal provides a temporally precise readout for recent transcriptional activity. (a) Time course of Arc transcription in CA1 neurons after a 5-min exposure to a novel environment. The time points given indicate time after removal from the environment and have been published (16). Note that the proportion of CA1 neurons with Arc INF returns to baseline levels within 16 min after removal from the environment. (b) Activation of Arc transcription in CA1 neuronal ensembles is environmental context specific. Nuclei are indicated by open circles; Arc transcription foci (INF) are indicated by two dark spots in the nuclei; cytoplasmic Arc mRNA is indicated by gray shading around nuclei. In rats exposed to the same environment twice, with each exposure separated by 25 min (A × A group; Upper), the majority of Arc positive cells contain both cytoplasmic Arc signal and INF, indicating activation of Arc transcription in the same cell population during each exposure. By contrast, in rats exposed sequentially to two different environments (A × B group; Lower), a more heterogeneous pattern of Arc staining was seen, with roughly equal proportions of cells containing only Arc cytoplasmic staining or Arc INF staining, and a smaller proportion containing both Arc cytoplasmic and INF staining. This observation indicated that the different environments activated statistically independent populations of neurons. This diagram is based on data from ref. . (c) Behavioral timeline for the experimental groups of experiments 1 and 2. The diagram approximates the timing of the handling of the groups on a linear scale, with the exception of the “Spaced” and “Massed-II” groups where the double hatch markings indicate longer periods between the environment exposures. [Image in a reproduced with permission from ref. (Copyright 2002, Society for Neuroscience).]
Fig. 2.
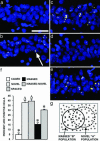
Nine exposures to an environmental context separated by 25 min, but not 24 h, decrease the proportion of Arc+ CA1 neurons. Confocal projection images from the CA1 region for each experimental condition: CAGED group (a); NOVEL group (b); SPACED group (c); MASSED-I group (d); MASSED–NOVEL group (e). The arrow in b indicates a cell containing two Arc transcription foci (yellow color) within a cell nucleus (blue color). (Scale bar, 50 μm.) (f) The percentage of Arc+ CA1 neurons (mean ± SEM) for the five behavioral groups is indicated. *, Different from all other behavioral groups (P < 0.02). Δ, different from CAGED, MASSED, and MASSED–NOVEL groups (P < 0.02). n = 4–6 rats per group. (g) Illustration explaining results from the MASSED–NOVEL group. Repeated exposure to environment B decreases the probability of Arc transcription by ≈63% in the “MASSED-B” cell population, these refractory cells are indicated with an “X” over a closed circle. The open circles indicate cells capable of Arc transcription. Based on the principle of random selection with replacement, 16% of the 40% of CA1 cells active in environment A would have also been active in environment B. At 63% failure rate, however, only 6% of the “AB overlap” population would be capable of activating Arc transcription. Therefore, the percentage of cells activating Arc transcription in the final “NOVEL-A” exposure is predicted to be 30% (24% + 6%), essentially identical to the observed value for the MASSED–NOVEL group.
Fig. 3.
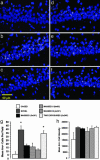
Four context exposures, separated by 25 min, are sufficient to inhibit Arc transcriptional activation. Confocal projection images of Arc intronic RNA signal (yellow color) and cell nuclei (blue color) from the CA1 region for each experimental condition: CAGED controls (a); NOVEL group (b); MASSED-I group (c); MASSED-II group (d); MASSED-III group (e); and TWO EXPOSURES group (f). (g) The number of Arc+ CA1 neurons (mean ± SEM) per field for each behavioral group. Overall ANOVA indicated a significant difference among the groups (_F_5,214 = 10.99, P < 0.0001). *, Different from caged, MASSED-I, MASSED-II, and MASSED-III groups (P < 0.01). (h) The comparison of average integrated fluorescent intensities per Arc+ cell did not reveal a significant difference among the various behavioral groups. n = 5 rats per group.
Fig. 4.
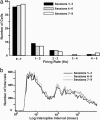
Firing properties of CA1 neurons do not change with repeated exposures to an environmental context within a single day. The response properties of multiple single CA1 neurons from rats repeatedly exposed to the same environment within a single day were determined by using parallel extracellular recording methods. (a) Cell firing data from 50 cells (from three rats) were grouped into three blocks (sessions 1–3, 4–6, and 7–9) and binned according to firing rate. (b) Log scaled, interspike interval distribution for the three session blocks. Note that neither the mean firing rate (a) nor the interspike interval (b) changed over the course of the repeated exposures. The number of cells recorded from each of the three rats was 9, 14, and 27 pyramidal cells, and these electrophysiological data were pooled for subsequent analyses.
Similar articles
- Spatial exploration-induced Arc mRNA and protein expression: evidence for selective, network-specific reactivation.
Ramírez-Amaya V, Vazdarjanova A, Mikhael D, Rosi S, Worley PF, Barnes CA. Ramírez-Amaya V, et al. J Neurosci. 2005 Feb 16;25(7):1761-8. doi: 10.1523/JNEUROSCI.4342-04.2005. J Neurosci. 2005. PMID: 15716412 Free PMC article. - Rapid activation of plasticity-associated gene transcription in hippocampal neurons provides a mechanism for encoding of one-trial experience.
Miyashita T, Kubik S, Haghighi N, Steward O, Guzowski JF. Miyashita T, et al. J Neurosci. 2009 Jan 28;29(4):898-906. doi: 10.1523/JNEUROSCI.4588-08.2009. J Neurosci. 2009. PMID: 19176799 Free PMC article. - Accuracy of hippocampal network activity is disrupted by neuroinflammation: rescue by memantine.
Rosi S, Ramirez-Amaya V, Vazdarjanova A, Esparza EE, Larkin PB, Fike JR, Wenk GL, Barnes CA. Rosi S, et al. Brain. 2009 Sep;132(Pt 9):2464-77. doi: 10.1093/brain/awp148. Epub 2009 Jun 16. Brain. 2009. PMID: 19531533 Free PMC article. - The immediate early gene arc/arg3.1: regulation, mechanisms, and function.
Bramham CR, Worley PF, Moore MJ, Guzowski JF. Bramham CR, et al. J Neurosci. 2008 Nov 12;28(46):11760-7. doi: 10.1523/JNEUROSCI.3864-08.2008. J Neurosci. 2008. PMID: 19005037 Free PMC article. Review. - Transcriptional and post-translational regulation of Arc in synaptic plasticity.
Carmichael RE, Henley JM. Carmichael RE, et al. Semin Cell Dev Biol. 2018 May;77:3-9. doi: 10.1016/j.semcdb.2017.09.007. Epub 2017 Sep 7. Semin Cell Dev Biol. 2018. PMID: 28890422 Review.
Cited by
- Decoding Arc transcription: a live-cell study of stimulation patterns and transcriptional output.
Kim DW, Moon HC, Lee BH, Park HY. Kim DW, et al. Learn Mem. 2024 Sep 11;31(8):a054024. doi: 10.1101/lm.054024.124. Print 2024 Aug. Learn Mem. 2024. PMID: 39260877 - Neuronal enhancers fine-tune adaptive circuit plasticity.
Griffith EC, West AE, Greenberg ME. Griffith EC, et al. Neuron. 2024 Sep 25;112(18):3043-3057. doi: 10.1016/j.neuron.2024.08.002. Epub 2024 Aug 28. Neuron. 2024. PMID: 39208805 Review. - Targeted rescue of synaptic plasticity improves cognitive decline in sepsis-associated encephalopathy.
Grünewald B, Wickel J, Hahn N, Rahmati V, Rupp H, Chung HY, Haselmann H, Strauss AS, Schmidl L, Hempel N, Grünewald L, Urbach A, Bauer M, Toyka KV, Blaess M, Claus RA, König R, Geis C. Grünewald B, et al. Mol Ther. 2024 Jul 3;32(7):2113-2129. doi: 10.1016/j.ymthe.2024.05.001. Epub 2024 May 23. Mol Ther. 2024. PMID: 38788710 - Exercise induction at expression immediate early gene (c-Fos, ARC, EGR-1) in the hippocampus: a systematic review.
Rahmi U, Goenawan H, Sylviana N, Setiawan I, Putri ST, Andriyani S, Fitriana LA. Rahmi U, et al. Dement Neuropsychol. 2024 Apr 15;18:e20230015. doi: 10.1590/1980-5764-DN-2023-0015. eCollection 2024. Dement Neuropsychol. 2024. PMID: 38628561 Free PMC article. Review. - Contextual memory engrams, and the neuromodulatory influence of the locus coeruleus.
Grella SL, Donaldson TN. Grella SL, et al. Front Mol Neurosci. 2024 Feb 5;17:1342622. doi: 10.3389/fnmol.2024.1342622. eCollection 2024. Front Mol Neurosci. 2024. PMID: 38375501 Free PMC article. Review.
References
- Davis, H. & Squire, L. R. (1984) Psychol. Bull. 96, 518–559. - PubMed
- Clayton, D. F. (2000) Neurobiol. Learn. Mem. 74, 185–216. - PubMed
- Guzowski, J. F. (2002) Hippocampus 12, 86–104. - PubMed
- Lanahan, A. & Worley, P. (1998) Neurobiol. Learn. Mem. 70, 37–43. - PubMed
Publication types
MeSH terms
Substances
Grants and funding
- MH46823/MH/NIMH NIH HHS/United States
- AG023309/AG/NIA NIH HHS/United States
- R01 AG009219/AG/NIA NIH HHS/United States
- AG09219/AG/NIA NIH HHS/United States
- MH060123/MH/NIMH NIH HHS/United States
- R01 AG023309/AG/NIA NIH HHS/United States
- R01 MH060123/MH/NIMH NIH HHS/United States
- R37 MH046823/MH/NIMH NIH HHS/United States
- R01 MH046823/MH/NIMH NIH HHS/United States
LinkOut - more resources
Full Text Sources
Other Literature Sources
Miscellaneous


