Reversal of neuronal migration in a mouse model of fetal alcohol syndrome by controlling second-messenger signalings - PubMed (original) (raw)
Comparative Study
Reversal of neuronal migration in a mouse model of fetal alcohol syndrome by controlling second-messenger signalings
Tatsuro Kumada et al. J Neurosci. 2006.
Abstract
The brains of fetal alcohol syndrome patients exhibit impaired neuronal migration, but little is known about the mechanisms underlying this abnormality. Here we show that Ca2+ signaling and cyclic nucleotide signaling are the central targets of alcohol action in neuronal cell migration. Acute administration of ethanol reduced the frequency of transient Ca2+ elevations in migrating neurons and cGMP levels and increased cAMP levels. Experimental manipulations of these second-messenger pathways, through stimulating Ca2+ and cGMP signaling or inhibiting cAMP signaling, completely reversed the action of ethanol on neuronal migration in vitro as well as in vivo. Each second messenger has multiple but distinct downstream targets, including Ca2+/calmodulin-dependent protein kinase II, calcineurin, protein phosphatase 1, Rho GTPase, mitogen-activated protein kinase, and phosphoinositide 3-kinase. These results demonstrate that the aberrant migration of immature neurons in the fetal brain caused by maternal alcohol consumption may be corrected by controlling the activity of these second-messenger pathways.
Figures
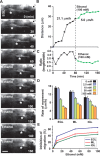
Figure 1.
Ethanol slows the migration of cerebellar granule cells in a dose-dependent manner. A, Time-lapse images showing that acute administration of ethanol (100 m
m
) slows the tangential migration of granule cells in the EGL of a cerebellar slice obtained from a P10 mouse. Asterisks and dots mark the granule cell soma and reference points for cell movement, respectively. Elapsed time is indicated in the bottom right of each photograph. Scale bars, 12 μm. B, C, Effects of 100 m
m
ethanol on the total distance traversed by the granule cell soma (B) shown in A and the length/width ratio of the soma (C). D, Effects of different doses (2.5–100 m
m
) of ethanol on the migration rate of granule cells among three cerebellar cortical layers. Each column represents the average rate of cell movement obtained from at least 60 migrating cells. Error bars indicate SD. E, Inhibition rates of granule cell migration in the three cerebellar cortical layers by acute administration of ethanol (2.5–100 m
m
).
Figure 2.
Ethanol directly inhibits the migration of isolated granule cells in the microexplant cultures. A, Time-lapse images showing that an application of ethanol (100 m
m
) directly slows the migration of isolated granule cells in the microexplant cultures of P1 mouse cerebellum. Black and red asterisks mark the granule cell soma. Elapsed time is indicated at the top of each photograph. Scale bars, 12μm. B, Two sets of superimposed images of the granule cells shown in A represent the cell movement before and after an application of 100 m
m
ethanol. Scale bars, 12 μm. C, Sequential changes in the distance traveled by the granule cell soma shown in A before and after an application of 100 m
m
ethanol. D, Dose-dependent reduction of the rate of granule cell migration in the microexplant cultures by an acute exposure of ethanol (25–200 m
m
). Each column represents the average rates obtained from at least 100 migrating cells. Error bars indicate SD.
Figure 3.
Ethanol action on granule cell migration depends on intracellular Ca2+ signaling. A, Reduction of spontaneous intracellular Ca2+ transients in the granule cell soma by ethanol (100 m
m
). F/F0 represents the fluorescent intensity of Oregon Green 488 BAPTA-1 divided by its baseline fluorescent intensity. B, Histograms showing the dose-dependent reduction of the frequency of Ca2+ transients in the granule cell somata by ethanol (25–200 m
m
). Each column represents the average frequency of spontaneous Ca2+ transients obtained from at least 50 migrating cells. Error bars indicate SD. C–F, Changes in the effects of various concentrations (0 m
m
in C, 25 m
m
in D, 50 m
m
in E, and 100 m
m
in F) of ethanol on the rate of granule cell migration by an application of caffeine (1 m
m
), nicotine (1 μ
m
), and NMDA (30 μ
m
). Each column represents the average rate of cell movement obtained from at least 40 migrating cells. Error bars indicate SD. *p < 0.05; **p < 0.01.
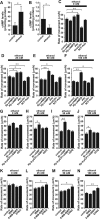
Figure 4.
Cyclic nucleotide signaling plays a key role in the ethanol-induced inhibition of granule cell migration. A, B, Changes in cAMP levels (A) and cGMP levels (B) in the P10 mouse cerebellum induced by an intraperitoneal injection of ethanol (5 g/kg body weight). Each column represents the average values obtained from 11 mouse cerebella for cAMP measurements and from 12 mouse cerebella for cGMP measurements. C–F, Changes in the effects of various concentrations (0 m
m
in C, 25 m
m
in D, 50 m
m
in E, and 100 m
m
in F) of ethanol on the rate of granule cell migration by altering cAMP signaling with Sp-cAMPS (20 μ
m
), Rp-cAMPS (100 μ
m
), PKI (5μ
m
), forskolin (30μ
m
), or 9CP-Ade (30μ
m
). G–J, Changes in the effects of various concentrations (0 m
m
in G, 25 m
m
in H, 50 m
m
in I, and 100 m
m
in J) of ethanol on the rate of granule cell migration by altering cGMP signaling with Br-cGMP (100 μ
m
), Rp-8-pCPT-cGMPS (5 μ
m
), or ODQ (1.5 μ
m
). K–N, Changes in the effects of various concentrations (0 m
m
in K,25 m
m
in L,50m
m
in M, and 100 m
m
in N) of ethanol on the rate of granule cell migration by altering the activity of cyclic nucleotide PDEs with IBMX (30μ
m
), 8-MM-IBMX (20μ
m
), or EHNA (10 μ
m
). In C–N, each column represents the average rate of cell movement obtained from at least 40 migrating cells. Error bars indicate SD. *p < 0.05; **p < 0.01.
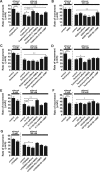
Figure 5.
Effects of caffeine, NMDA, forskolin, Rp-cAMPS, Br-cGMP, and EHNA on the ethanol-induced reduction of transient Ca2+ elevations in the granule cell somata. A, Effects of caffeine (1 m
m
) and NMDA (30μ
m
) on the frequency of Ca2+ transients in the granule cell somata in the presence and absence of ethanol (50 and 100 m
m
). B, Effects of forskolin (30μ
m
), Rp-cAMPS (100 μ
m
), and BAPTA-AM (10 μ
m
) on the frequency of Ca2+ transients in the granule cell somata in the presence and absence of ethanol (100 m
m
). C, Effects of Br-cGMP (100μ
m
) on the frequency of Ca2+ transients in the granule cell somata in the presence and absence of ethanol (50 and 100 m
m
). D, Effects of EHNA (10 μ
m
) on the frequency of Ca2+ transients in the granule cell somata in the presence and absence of ethanol (50 and 100 m
m
). In A–D, each column represents the average values obtained from atleast 50 migrating cells. Error bars indicate SD. *p < 0.05; **p < 0.01.
Figure 6.
The reversal of ethanol-induced aberrant neuronal migration by Ca2+ and cyclic nucleotide signaling is mediated by multiple and distinctive downstream effectors. A–G, Changes in the effects of caffeine (1 m
m
), NMDA (30 μ
m
), Rp-cAMPS (100 μ
m
), and Br-cGMP (100 μ
m
) on the ethanol (100 m
m
)-induced inhibition of granule cell migration by inhibiting protein kinase C with calphostin C (100 n
m
)(A), inhibiting CaMKII with KN93 (5 μ
m
)(B), inhibiting calcineurin with deltamethrin (10 n
m
)(C), inhibiting PP1 with tautomycine (4 n
m
)(D), inhibiting Rho GTPase with H-1152 (1μ
m
)(E), inhibiting MAPK with U0126 (10μ
m
) (F), and inhibiting PI3K with LY294002 (10μ
m
)(G). In A–G, each column represents the average rate of cell movement obtained from at least 50 migrating cells. Error bars indicate SD. *p < 0.05; **p < 0.01.
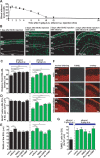
Figure 7.
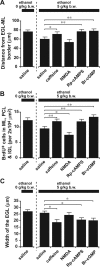
Ethanol action on granule cell migration in vivo is reversed by administration of caffeine, NMDA, Rp-cAMPS, and Br-cGMP. A, Sequential changes in blood ethanol levels after intraperitoneal injection of ethanol (5 g/kg body weight; 25%, v/v mixed in saline) into P10 mice. B, Effects of ethanol and caffeine on the translocation of BrdU-labeled granule cells in the postnatal mouse cerebellum. P9 mice were injected intraperitoneally with BrdU (50 mg/kg body weight). One day after BrdU injection (at P10), mice were injected with 100 μl of saline or caffeine (15 mg/kg body weight) into the peritoneal cavity with or without ethanol injection (5 g/kg body weight; 25%, v/v mixed in saline). C–E, Effects of intraperitoneal injection of 100 μl of caffeine (15 mg/kg body weight), NMDA (2 mg/kg body weight), Rp-cAMPS (2 mg/kg body weight), or Br-cGMP (2 mg/kg body weight) on ethanol (5 g/kg body weight)-induced changes in the distance of the BrdU-labeled granule cells from the EGL–ML borders (C), in the number of BrdU-labeled cells in the ML, PCL, and IGL (D), and in the width of the EGL (E). Each column represents the average values obtained from >1200 migrating cells in C and D and 38 external granular layers in E. F, Apoptotic cell death of granule cells and their precursors by an intraperitoneal injection of ethanol (5 g/kg body weight) alone or ethanol (5 g/kg body weight) and caffeine (15 mg/kg body weight). G, Effects of intraperitoneal injection of caffeine (15 mg/kg body weight), NMDA (2 mg/kg body weight), Rp-cAMPS (2 mg/kg body weight), and Br-cGMP (2 mg/kg body weight) on the ethanol (5 g/kg body weight)-induced apoptotic cell death of granule cells and their precursors in the EGL. In G, each column represents the average value obtained from at least 400 cells. Error bars indicate SD. *p < 0.05; **p < 0.01. b.w., Body weight; i.p., intraperitoneal.
Figure 8.
Reversal of ethanol action on granule cell migration in vivo by injection of caffeine, Rp-cAMPS, and Br-cGMP into the subarachnoid space between the skull and the surface of the cerebellum. A–C, Effects of injection of 5 μl of caffeine (2 mg/kg body weight), NMDA (0.01 mg/kg body weight), Rp-cAMPS (0.4 mg/kg body weight), and Br-cGMP (0.4 mg/kg body weight) into the subarachnoid space between the skull and the surface of the cerebellum on the ethanol (5 g/kg body weight)-induced changes in the distance of the BrdU-labeled granule cells from the EGL-ML borders (A), the number of BrdU-labeled cells in the ML, PCL, and IGL (B), and the width of the EGL (C). In A–C, each column represents the average value obtained from >1000 migrating cells in A and B and 40 external granular layers in C. Error bars indicate SD. *p < 0.05; **p < 0.01.
Similar articles
- Inhibition of cerebellar granule cell turning by alcohol.
Kumada T, Komuro Y, Li Y, Hu T, Wang Z, Littner Y, Komuro H. Kumada T, et al. Neuroscience. 2010 Nov 10;170(4):1328-44. doi: 10.1016/j.neuroscience.2010.07.059. Epub 2010 Aug 5. Neuroscience. 2010. PMID: 20691765 Free PMC article. - The NO-cGMP-PKG pathway plays an essential role in the acquisition of ethanol resistance by cerebellar granule neurons.
Bonthius DJ, Karacay B, Dai D, Hutton A, Pantazis NJ. Bonthius DJ, et al. Neurotoxicol Teratol. 2004 Jan-Feb;26(1):47-57. doi: 10.1016/j.ntt.2003.08.004. Neurotoxicol Teratol. 2004. PMID: 15001213 - How does alcohol impair neuronal migration?
Kumada T, Jiang Y, Cameron DB, Komuro H. Kumada T, et al. J Neurosci Res. 2007 Feb 15;85(3):465-70. doi: 10.1002/jnr.21149. J Neurosci Res. 2007. PMID: 17139684 Review. - Ethanol impairs Rho GTPase signaling and differentiation of cerebellar granule neurons in a rodent model of fetal alcohol syndrome.
Joshi S, Guleria RS, Pan J, Bayless KJ, Davis GE, Dipette D, Singh US. Joshi S, et al. Cell Mol Life Sci. 2006 Dec;63(23):2859-70. doi: 10.1007/s00018-006-6333-y. Cell Mol Life Sci. 2006. PMID: 17109064 Free PMC article. - The role of calcium and cyclic nucleotide signaling in cerebellar granule cell migration under normal and pathological conditions.
Komuro Y, Galas L, Lebon A, Raoult E, Fahrion JK, Tilot A, Kumada T, Ohno N, Vaudry D, Komuro H. Komuro Y, et al. Dev Neurobiol. 2015 Apr;75(4):369-87. doi: 10.1002/dneu.22219. Epub 2014 Aug 1. Dev Neurobiol. 2015. PMID: 25066767 Review.
Cited by
- Recent breakthroughs in understanding the cerebellum's role in fetal alcohol spectrum disorder: A systematic review.
Leung ECH, Jain P, Michealson MA, Choi H, Ellsworth-Kopkowski A, Valenzuela CF. Leung ECH, et al. Alcohol. 2024 Sep;119:37-71. doi: 10.1016/j.alcohol.2023.12.003. Epub 2023 Dec 13. Alcohol. 2024. PMID: 38097146 Review. - Ion channels, guidance molecules, intracellular signaling and transcription factors regulating nervous and vascular system development.
Akita T, Kumada T, Yoshihara S, Egea J, Yamagishi S. Akita T, et al. J Physiol Sci. 2016 Mar;66(2):175-88. doi: 10.1007/s12576-015-0416-1. Epub 2015 Oct 27. J Physiol Sci. 2016. PMID: 26507418 Free PMC article. Review. - Cellular commitment in the developing cerebellum.
Marzban H, Del Bigio MR, Alizadeh J, Ghavami S, Zachariah RM, Rastegar M. Marzban H, et al. Front Cell Neurosci. 2015 Jan 12;8:450. doi: 10.3389/fncel.2014.00450. eCollection 2014. Front Cell Neurosci. 2015. PMID: 25628535 Free PMC article. Review. - Mechanisms of ethanol-induced degeneration in the developing, mature, and aging cerebellum.
Jaatinen P, Rintala J. Jaatinen P, et al. Cerebellum. 2008;7(3):332-47. doi: 10.1007/s12311-008-0034-z. Epub 2008 Apr 12. Cerebellum. 2008. PMID: 18418667 Review. - Role of PACAP in controlling granule cell migration.
Cameron DB, Raoult E, Galas L, Jiang Y, Lee K, Hu T, Vaudry D, Komuro H. Cameron DB, et al. Cerebellum. 2009 Dec;8(4):433-40. doi: 10.1007/s12311-009-0121-9. Epub 2009 Jun 23. Cerebellum. 2009. PMID: 19548046 Review.
References
- Affolter M, Weijer CJ (2005) Signaling to cytoskeleton dynamics during chemotaxis. Dev Cell 9: 19–34. - PubMed
- Bandyopadhyay J, Lee J, Lee J, Lee JI, Yu JR, Jee C, Cho JH, Jung S, Lee MH, Zannoni S, Singson A, Kim do H, Koo HS, Ahnn J (2002) Calcineurin, a calcium/calmodulin-dependent protein phosphatase, is involved in movement, fertility, egg laying, and growth in Caenorhabditis elegans Mol Biol Cell 13: 3281–3293. - PMC - PubMed
- Beavo JA, Brunton LL (2002) Cyclic nucleotide research: still expanding after half a century. Nat Rev Mol Cell Biol 3: 710–718. - PubMed
- Berridge MJ, Bootman MD, Roderick HL (2003) Calcium signaling: dynamics, homeostasis and remodeling. Nat Rev Mol Cell Biol 4: 517–529. - PubMed
Publication types
MeSH terms
Substances
LinkOut - more resources
Full Text Sources
Medical
Miscellaneous
