Mechanism of polarization of Listeria monocytogenes surface protein ActA - PubMed (original) (raw)
Mechanism of polarization of Listeria monocytogenes surface protein ActA
Susanne M Rafelski et al. Mol Microbiol. 2006 Feb.
Abstract
The polar distribution of the ActA protein on the surface of the Gram-positive intracellular bacterial pathogen, Listeria monocytogenes, is required for bacterial actin-based motility and successful infection. ActA spans both the bacterial membrane and the peptidoglycan cell wall. We have directly examined the de novo ActA polarization process in vitro by using an ActA-RFP (red fluorescent protein) fusion. After induction of expression, ActA initially appeared at distinct sites along the sides of bacteria and was then redistributed over the entire cylindrical cell body through helical cell wall growth. The accumulation of ActA at the bacterial poles displayed slower kinetics, occurring over several bacterial generations. ActA accumulated more efficiently at younger, less inert poles, and proper polarization required an optimal balance between protein secretion and bacterial growth rates. Within infected host cells, younger generations of L. monocytogenes initiated motility more quickly than older ones, consistent with our in vitro observations of de novo ActA polarization. We propose a model in which the polarization of ActA, and possibly other Gram-positive cell wall-associated proteins, may be a direct consequence of the differential cell wall growth rates along the bacterium and dependent on the relative rates of protein secretion, protein degradation and bacterial growth.
Figures
Fig. 1
ActA–RFP topology and localization by immunofluorescence.
- Diagram of the topology of ActA–RFP association with the bacterial cell wall.
- Immunofluorescence of wild-type ActA using an ActA antibody. Top panel shows the ActA distribution on strain DPL-4087 (constitutively expressing ActA) and bottom panel shows ActA in strain DPL-4077 induced to stage IV of polarization.
- Surface distributions of strains expressing ActA–RFP. Left panels show the ActA–RFP distribution by immunofluorescence as in B. Right panels show RFP fluorescence signal on the inside of bacteria. Top panel shows strain JAT-396 (constitutively expressing ActA–RFP) and bottom panel shows ActA–RFP in strain JAT-395 induced to stage IV of polarization. All strains exhibit the same normal polarized surface distribution of ActA with most protein at the poles and least at the septation zone. The ActA–RFP distribution is the same when visualized by immunofluorescence using an ActA antibody to protein accessible on the outside of bacteria and by the RFP signal on the inside of bacteria. A slight shift of RFP signal further inside bacteria can be seen. Bar = 2 µm.
Fig. 2
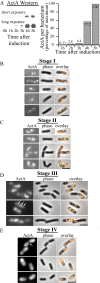
Time-course of ActA–RFP induction and polarization in vitro. All ActA–RFP inductions were performed on strain JAT-395 (Rafelski and Theriot, 2005).
- Relative amounts of ActA–RFP per bacterium during an induction time-course as determined by Western blot analysis. Left panel shows two exposures of a representative immunoblot. Right graph shows quantitation of Western blot with amounts shown as a percentage of the maximum.
- Polarization stage I. Bacteria displaying the earliest visible ActA–RFP signal, 20–30 min after induction. Initial ActA–RFP accumulation occurred in one to four spots along the sides of bacteria.
- Polarization stage II. A little later in induction (30 min−1 h later) bacteria displayed an ActA–RFP distribution pattern of irregular patches covering distinct regions of the surface. New ActA–RFP accumulation in spots continued to be seen (top panel). Patches occurred along the sides of bacteria, not at the poles, nor the septation zone.
- Polarization stage III. ActA–RFP signal continued to increase and protein was seen to cover greater areas of the surface but still remained absent from the poles. Patterns were often reminiscent of a helical surface distribution, as indicated by the arrows. Surface distribution patterns varied greatly among bacteria within a population.
- Polarization stage IV. Bacteria display a fully polarized ActA–RFP distribution 3–6 h after initial induction. Protein continued to fill in along the sides of bacteria creating a continuous distribution. Additionally, protein was now seen at the poles and remained absent from the septation zone (arrow) as previously described (Kocks et al., 1993; Rafelski and Theriot, 2005).
Bar = 2 µm. Far left panels show ActA–RFP signal, centre panels show phase-contrast and far right panels show an overlay of ActA–RFP onto the phase-contrast image to visualize the localization of protein on the bacterial surface.
Fig. 3
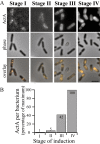
Sudden increase in overall ActA–RFP levels corresponds to an increase in ActA–RFP signal along cylindrical body.
- Representative images from stages I–IV during an induction time-course. Top panels show ActA–RFP signal, middle panels show phase-contrast and bottom panels show an overlay of ActA–RFP onto the phase-contrast image. Bar = 2 µm.
- Relative levels of RFP signal per bacterium at each stage in the induction time-course shown in A. Amounts shown as a percentage of the maximum. The sudden increase in RFP levels on bacteria occurred between stages II and III of polarization (approximately eightfold increase) during which ActA–RFP accumulated along the cylindrical body of bacteria but not directly at the poles. Accumulation of ActA–RFP at the poles occurred later in induction, at stage IV, when protein levels had increased approximately another twofold.
Fig. 4
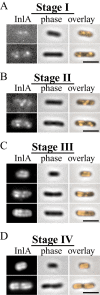
Time-course of InlA induction and polarization in vitro. InlA was induced identically to ActA in strains JAT-395 and DPL-3078 (Δ-actA in 10403S background) and visualized by immunofluorescence at different times during induction. Stages of polarization were identical in both strains and DPL-3078 is shown here.
- InlA polarization stages I–IV. InlA exhibited stages of polarization similar to those observed for ActA (Fig. 2) over the course of several (three to four) hours.
Fig. 5
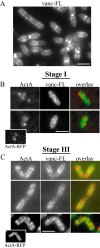
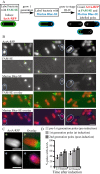
ActA–RFP and vanc-FL have a non-overlapping surface distribution.
- L. monocytogenes stained with fluorescently labelled vancomycin (vanc-FL). Vanc-FL patterns were identical to those previously described on B. subtilis and the pairs of dots along the sides of the cylindrical body are typical of a helical distribution (Daniel and Errington, 2003).
- Immunofluorescence of earliest ActA–RFP signal detectable at polarization stage I (∼20 min after induction). Left panels show ActA, the centre panels show vanc-FL staining and the far right panels show an overlay, with ActA in red and vanc-FL in green. Initial spots of ActA localize to regions on the bacterium with less vanc-FL staining. Inset in bottom example shows ActA–RFP signal for that bacterium.
- Bacteria at polarization stage III. The top two panels on far left show ActA–RFP signal on live bacteria. The bottom panel on far left shows ActA–RFP on a bacterium at the same stage of induction by immunofluorescence. Left, centre and right panels are as in B. ActA signal localizes to regions of the bacterium with less vanc-FL signal. Inset in bottom example shows ActA–RFP signal for that bacterium.
Bar = 2 µm.
Fig. 6
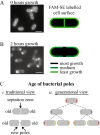
Differential growth along bacterium visualized by cell wall labelling.
- Bacteria labelled with FAM-SE show a uniform surface distribution with staining at the septation zones. Diagram on the right indicates uniform FAM-SE distribution at the time of labelling.
- Bacteria from A 2 h of growth later. The most fluorescent signal is seen at the poles, the least at the septation zones and intermediate amounts along the sides of bacteria, also diagrammed on the right. Regions with most growth show least FAM-SE labelling. Left panel is FAM-SE labelling. Bar = 2 µm.
- Two ways of considering the age of the bacterial poles. (i) Traditionally a single bacterial division is considered. The poles of the original bacterium are considered the old poles while the poles created from the septation zone upon division are considered the new poles. (ii) Over several generations, the poles that are created in each generation can be assigned a generational age. Poles of the first generation (marked with a 1) are considered the oldest poles while poles of the last generation (here marked as 3) are the youngest.
Fig. 7
ActA–RFP preferentially localizes to younger poles.
- Schematic of the experimental design. Diagram along the bottom indicate the type of staining on poles of the first, second and later (> 2) generations (white numbers). The poles already present at the time of induction are considered the first generation. Bacteria were labelled with FAM-SE (uniformly green) and ActA–RFP was induced. One generation later, bacteria were labelled with Marina Blue-SE (older poles now labelled green and blue, younger poles labelled only in blue) and grown until ActA–RFP began to polarize (late stage III–early stage IV). Several categories of labelled bacteria are now present in the population, as represented by the schematic bacteria in the diagram. Unlabelled poles can be from any generation younger than the second generation.
- Images from experiment described in A. Top panel shows ActA–RFP signal on bacteria and the second and third panels show FAM-SE and Marina Blue-SE staining. The fourth and fifth panels from the top show the overlays of ActA–RFP (red) with FAM-SE (green) and Marina Blue-SE (blue), respectively. Poles of the first generation are labelled with both green and blue (green arrows) while poles of the second generation are labelled only with blue (blue circles). ActA–RFP signal is markedly absent from older generation poles (see green arrows in top panel) while younger generation poles are associated with ActA–RFP (blue circles in top panel). Bar = 2 µm.
- Larger images of the two bacteria marked with asterisks in A. Left panel shows ActA–RFP, right panel shows overlays with ActA–RFP in red and either FAM-SE (top, in green) or Marina-SE (bottom, blue). Bar = 1 µm.
- Quantitation of a parallel set of experiments in which three sequential generations were labelled. The experiment was quantitated at two time points, 1 h apart (3.5 and 4.5 h after induction) when the protein was beginning to accumulate at the poles (late stage III–early stage IV). The percentage of poles associated with ActA–RFP was greatest for the youngest, second generation poles and least for the oldest, pre-first generation poles. An increase in the percentage of poles associated with ActA–RFP was seen from 3.5 to 4.5 h for all generations. Between 188 and 381 bacteria are represented by the percentage values. All values were significantly different (_Z_-test P < 0.05). Error bars show 95% confidence interval.
Fig. 8
ActA–RFP is retained at the inert poles.
- Bacteria were induced for 2 h after ActA–RFP was at polarization stage IV then labelled with FAM-SE. The left panel shows uniform FAM-SE labelling as in 6A. The right panel shows that ActA–RFP on the surface of these bacteria is uniform as well, because of continual accumulation of protein.
- Bacteria from A grown for several generations without induction. Left panels show that fluorescent signal is retained at those poles that were initially labelled while absent from other poles. Right panels show brightest ActA–RFP signal at the same poles that are labelled with FAM-SE, indicating that protein was retained at those poles.
Bar = 2 µm.
Fig. 9
Tracking of polar generations from a single bacterium in an infected Ptk2 cell.
- The generational lineage originating from the single bacterium within the cell seen in Movie 1. Coloured numbers indicate the generational age of the poles. First generation poles were already existent at time of infection, analogous to the first generation poles in Figs 5 and 6, already existent at time of ActA–RFP induction. Circles indicate the generation that began moving. Single asterisk (*) refers to first generation poles that moved very slowly, and, in the absence of a circled number, stopped moving for a period of time. Double asterisk (**) refers to bacteria that had already begun moving, but continued movement after the subsequent division, and are not diagrammed in B. Light grey, outlined bacteria and their progeny were not trackable in the time-lapse movie because they had moved out of the field of view.
- Table of bacteria shown in A with the times at which they began moving. Within each generation row, bacteria from the top to bottom in the table are shown from left to right in A. Times shown were rounded to the closest 30 s. Single asterisks (*) indicate the first generation poles marked in A. Double asterisks (**) indicate the poles that continued moving over several generations in A but are shown only for the generation at which the first began moving.
Fig. 10
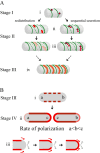
Multi-step model for passive polarization of ActA.
- A.
3-D representations of possible mechanisms leading to the observed polarization stages I–III. Darkest green lines represent newest cell wall growth, and successively lighter dashed green lines represent successively older cell wall material twisting and changing pitch as new material is incorporated into the cell wall (similar to Carballido-Lopez and Errington, 2003). Darkest red shading represents the greatest concentration of ActA protein over a specific surface area. (i) ActA protein is secreted in several distinct spots along the cylindrical body away from sites of new cell wall synthesis. (ii and iii) ActA is spread over the cylindrical body through two non-exclusive mechanisms: redistribution and sequential secretion. In redistribution spots of ActA already on the surface are stretched into patches through the movement of older cell wall as new cell wall is inserted, effectively pushing protein around. ActA initially present in (i) is diluted, represented by the lighter shades of red. In sequential secretion, ActA continues to be secreted in spots at a site that remains stationary in space (circled in black) as the cell wall moves around it. In (ii), the spot of ActA secreted in (i) has moved because of new cell wall growth. (iv) Eventually, as more ActA accumulates and is spread along the entire bacterial length, the combination of both mechanisms leads to an ActA surface distribution reminiscent of helical cell wall synthesis but localized in a non-overlapping pattern. - 2-D cross-section representations of observed polarization stages III–IV. (i) Bacterium at the same polarization stage as in (A, iv). Red rectangles represent the helical ActA surface distribution as seen for a 2-D longitudinal cross-section through the centre of the bacterium. (ii) During the transition between stages III and IV, more protein accumulates until the distribution of ActA is more uniform along the cylindrical cell body, represented by the solid darkest red lines. ActA gradually accumulates directly at the poles. The poles of the oldest generation are indicated as ‘a’ and the poles of the youngest generation, created from the septation zone of the previous generation, are indicated as ‘c’. Protein accumulates most efficiently at ‘c’ and least efficiently at ‘a’, as indicated by sequentially lighter shades of red and thinner lines. (iii) A possible mechanism for ActA accumulation at the poles. Slow incorporation of cylindrical cell wall material and ActA protein is shown in red, and indicated by red arrows. Grey arrows indicate continual shedding of cell wall material from the poles.
Similar articles
- Association of ActA to peptidoglycan revealed by cell wall proteomics of intracellular Listeria monocytogenes.
García-del Portillo F, Calvo E, D'Orazio V, Pucciarelli MG. García-del Portillo F, et al. J Biol Chem. 2011 Oct 7;286(40):34675-89. doi: 10.1074/jbc.M111.230441. Epub 2011 Aug 16. J Biol Chem. 2011. PMID: 21846725 Free PMC article. - Evidence implicating the 5' untranslated region of Listeria monocytogenes actA in the regulation of bacterial actin-based motility.
Wong KK, Bouwer HG, Freitag NE. Wong KK, et al. Cell Microbiol. 2004 Feb;6(2):155-66. doi: 10.1046/j.1462-5822.2003.00348.x. Cell Microbiol. 2004. PMID: 14706101 - ActA of Listeria monocytogenes and Its Manifold Activities as an Important Listerial Virulence Factor.
Pillich H, Puri M, Chakraborty T. Pillich H, et al. Curr Top Microbiol Immunol. 2017;399:113-132. doi: 10.1007/82_2016_30. Curr Top Microbiol Immunol. 2017. PMID: 27726006 Review. - Polarized distribution of Listeria monocytogenes surface protein ActA at the site of directional actin assembly.
Kocks C, Hellio R, Gounon P, Ohayon H, Cossart P. Kocks C, et al. J Cell Sci. 1993 Jul;105 ( Pt 3):699-710. doi: 10.1242/jcs.105.3.699. J Cell Sci. 1993. PMID: 8408297 - Classes and functions of Listeria monocytogenes surface proteins.
Popowska M, Markiewicz Z. Popowska M, et al. Pol J Microbiol. 2004;53(2):75-88. Pol J Microbiol. 2004. PMID: 15478352 Review.
Cited by
- Host actin polymerization tunes the cell division cycle of an intracellular pathogen.
Siegrist MS, Aditham AK, Espaillat A, Cameron TA, Whiteside SA, Cava F, Portnoy DA, Bertozzi CR. Siegrist MS, et al. Cell Rep. 2015 Apr 28;11(4):499-507. doi: 10.1016/j.celrep.2015.03.046. Epub 2015 Apr 16. Cell Rep. 2015. PMID: 25892235 Free PMC article. - Polar localization of virulence-related Esx-1 secretion in mycobacteria.
Carlsson F, Joshi SA, Rangell L, Brown EJ. Carlsson F, et al. PLoS Pathog. 2009 Jan;5(1):e1000285. doi: 10.1371/journal.ppat.1000285. Epub 2009 Jan 30. PLoS Pathog. 2009. PMID: 19180234 Free PMC article. - Bacterial-Based Cancer Therapy (BBCT): Recent Advances, Current Challenges, and Future Prospects for Cancer Immunotherapy.
Gupta KH, Nowicki C, Giurini EF, Marzo AL, Zloza A. Gupta KH, et al. Vaccines (Basel). 2021 Dec 18;9(12):1497. doi: 10.3390/vaccines9121497. Vaccines (Basel). 2021. PMID: 34960243 Free PMC article. Review. - Curvature and torsion in growing actin networks.
Shaevitz JW, Fletcher DA. Shaevitz JW, et al. Phys Biol. 2008 Jun 16;5(2):026006. doi: 10.1088/1478-3975/5/2/026006. Phys Biol. 2008. PMID: 18560043 Free PMC article. - Illumination of growth, division and secretion by metabolic labeling of the bacterial cell surface.
Siegrist MS, Swarts BM, Fox DM, Lim SA, Bertozzi CR. Siegrist MS, et al. FEMS Microbiol Rev. 2015 Mar;39(2):184-202. doi: 10.1093/femsre/fuu012. Epub 2015 Jan 23. FEMS Microbiol Rev. 2015. PMID: 25725012 Free PMC article. Review.
References
- Bierne H, Mazmanian SK, Trost M, Pucciarelli MG, Liu G, Dehoux P, et al. Inactivation of the srtA gene in Listeria monocytogenes inhibits anchoring of surface proteins and affects virulence. Mol Microbiol. 2002;43:869–881. - PubMed
- Bohne J, Sokolovic Z, Goebel W. Transcriptional regulation of prfA and PrfA-regulated virulence genes in Listeria monocytogenes. Mol Microbiol. 1994;11:1141–1150. - PubMed
- Borezee E, Pellegrini E, Beretti JL, Berche P. SvpA, a novel surface virulence-associated protein required for intracellular survival of Listeria monocytogenes. Microbiology. 2001;147:2913–2923. - PubMed
Publication types
MeSH terms
Substances
LinkOut - more resources
Full Text Sources
Medical

