Beta1 integrin inhibitory antibody induces apoptosis of breast cancer cells, inhibits growth, and distinguishes malignant from normal phenotype in three dimensional cultures and in vivo - PubMed (original) (raw)
Beta1 integrin inhibitory antibody induces apoptosis of breast cancer cells, inhibits growth, and distinguishes malignant from normal phenotype in three dimensional cultures and in vivo
Catherine C Park et al. Cancer Res. 2006.
Abstract
Current therapeutic approaches to cancer are designed to target molecules that contribute to malignant behavior but leave normal tissues intact. beta(1) integrin is a candidate target well known for mediating cell-extracellular matrix (ECM) interactions that influence diverse cellular functions; its aberrant expression has been implicated in breast cancer progression and resistance to cytotoxic therapy. The addition of beta(1) integrin inhibitory agents to breast cancer cells at a single-cell stage in a laminin-rich ECM (three-dimensional lrECM) culture was shown to down-modulate beta(1) integrin signaling, resulting in malignant reversion. To investigate beta(1) integrin as a therapeutic target, we modified the three-dimensional lrECM protocol to approximate the clinical situation: before treatment, we allowed nonmalignant cells to form organized acinar structures and malignant cells to form tumor-like colonies. We then tested the ability of beta(1) integrin inhibitory antibody, AIIB2, to inhibit tumor cell growth in several breast cancer cell lines (T4-2, MDA-MB-231, BT474, SKBR3, and MCF-7) and one nonmalignant cell line (S-1). We show that beta(1) integrin inhibition resulted in a significant loss of cancer cells, associated with a decrease in proliferation and increase in apoptosis, and a global change in the composition of residual colonies. In contrast, nonmalignant cells that formed tissue-like structures remained resistant. Moreover, these cancer cell-specific antiproliferative and proapoptotic effects were confirmed in vivo with no discernible toxicity to animals. Our findings indicate that beta(1) integrin is a promising therapeutic target, and that the three-dimensional lrECM culture assay can be used to effectively distinguish malignant and normal tissue response to therapy.
Figures
Figure 1
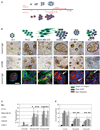
Morphology and response of breast cell lines to β1 integrin inhibition in three-dimensional lrECM. Five malignant breast cell lines (T4-2, MDA-MB-231, SKBR3, BT474, and MCF-7) and one nonmalignant breast cell line (S-1) were propagated in three-dimensional lrECM and treated with β1 integrin inhibitory antibody, AIIB2, after colonies were formed. A, schema of the three-dimensional lrECM assay used in this study. B, top and middle, phase-contrast micrographs of cultured colonies before and after antibody treatment, respectively. Bar, 20 µm. Bottom, confocal midsections of β1 integrin immunofluorescence ( ) of colonies cultured in three-dimensional lrECM. Phalloidin was used to stain actin filaments (
 ), and DAPI was used to stain individual nuclei (
 ). Bar, 13 µm for all cell lines shown. C, whereas there were no significant changes in Ki-67 or TUNEL expressing cells among nonmalignant S-1 cells after β1 integrin inhibition, malignant cell lines, except SKBR3, had a significant decrease in Ki-67 expressing cells and a significant increase in TUNEL-positive cells after antibody treatment. Columns, mean (n = 3); bars, SE. P < 0.05, t test.
Figure 2
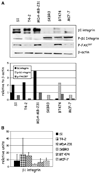
β1 Integrin, p-β1 integrin, and p-397FAK are expressed at different levels in breast cell lines in three dimensions. Lysates from five breast cancer cell lines (T4-2, MDA-MB-231, SKBR3, BT474, and MCF-7) and one nonmalignant cell line (S-1) in three-dimensional lrECM were probed by Western immunoblotting for total and p-β1 integrin and p-397FAK and for surface β1 integrin expression by FACS analysis. A, total β1 integrin levels are relatively high in S-1, T4-2, and MDA-MB-231 cells compared with SKBR3, BT474, and MCF7 cells. Conversely, p-β1 integrin levels are relatively low in S-1, T4-2, and MDA-MB-231 cells compared with SKBR3, BT474, and MCF7 cells. Expression of p-397FAK is expressed among all cell lines except SKBR3, where it is undetectable by Western blots. B, surface expression of β1 integrin by FACS analysis corresponds to that seen by immunofluorescence (Fig. 1_B_) and Western blots (Fig. 1_A_).
Figure 3
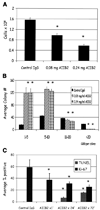
AIIB2 reduces both total cell number and average colony size in malignant cell lines. A, average number of T4-2 cells after 3 days of treatment with AIIB2. Columns, mean; bars, SE. P < 0.05, χ2. B, histogram showing the average colony size decreased with AIIB2 compared with controls. Columns, mean; bars, SE. P < 0.05, t test. C, percentage of Ki-67 and TUNEL expressing nuclei among T4-2 cells 1, 24, and 72 hours after addition of AIIB2 to cultures. Columns, mean; bars, SE. P < 0.05, t test.
Figure 4
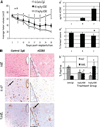
AIIB2 suppresses tumor growth in vivo by enhancing apoptosis and decreasing proliferation. A, mean tumor volumes among animals that received 1 mg/kg AIIB2 (■) or 5 mg/kg AIIB2 (△) were significantly smaller than control animals (♦). Points, mean (n = 9); bars, SE. A′, average serum concentration (µg/mL) of AIIB2 at the time of sacrifice was significantly higher in animals receiving AIIB2 compared with control vehicle. Columns, mean; bars, SD. A″, average number of animals in each treatment group that had histologic evidence of tumor at the time of sacrifice was significantly lower among treated animals compared to controls. Columns, mean for three separate experiments; bars, SE. *, P < 0.03, χ2. B, micrographs of serial sections of tumors that were scored for apoptosis by the presence of TUNEL-positive nuclei and for proliferation by the presence of Ki-67 nuclear antigen. Black ovals and triangles, coregistered regions in serial sections; arrows, examples of positive staining. _B_′, with AIIB2 treatment, the average number of TUNEL nuclei increased, and the number of Ki-67–positive nuclei decreased. Columns, mean; bars, SE. *, P < 0.05, χ2. Bar, 247 µm.
Figure 5
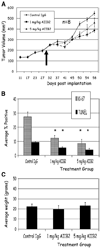
AIIB2 effectively induces cytostasis in established MCF-7 tumors in vivo with no toxicity. A, animals were randomized to receive treatment or control IgG 4 weeks after MCF-7 cell implantation (arrow, time of randomization at day 30). Mean tumor volumes for animals receiving 1 mg/kg AIIB2 (■) and 5 mg/kg AIIB2 (△) and nonspecific rat IgG1 (♦). Points, mean (n = 8); bars, SE. B, compared with controls, tumors from animals that received AIIB2 treatment had significantly fewer Ki-67–positive nuclei and fewer TUNEL-positive nuclei. Columns, mean; bars, SE. *, P < 0.001, χ2. C, average weight of control animals, and animals that received AIIB2 treatment were not significantly different at any biweekly time point measured throughout the experiment (data not shown) and at the end of the experiment. Columns, mean; bars, SE.
Similar articles
- Beta1 integrin inhibition dramatically enhances radiotherapy efficacy in human breast cancer xenografts.
Park CC, Zhang HJ, Yao ES, Park CJ, Bissell MJ. Park CC, et al. Cancer Res. 2008 Jun 1;68(11):4398-405. doi: 10.1158/0008-5472.CAN-07-6390. Cancer Res. 2008. PMID: 18519702 Free PMC article. - Cellular growth and survival are mediated by beta 1 integrins in normal human breast epithelium but not in breast carcinoma.
Howlett AR, Bailey N, Damsky C, Petersen OW, Bissell MJ. Howlett AR, et al. J Cell Sci. 1995 May;108 ( Pt 5):1945-57. doi: 10.1242/jcs.108.5.1945. J Cell Sci. 1995. PMID: 7544798 - Beta1-integrin circumvents the antiproliferative effects of trastuzumab in human epidermal growth factor receptor-2-positive breast cancer.
Lesniak D, Xu Y, Deschenes J, Lai R, Thoms J, Murray D, Gosh S, Mackey JR, Sabri S, Abdulkarim B. Lesniak D, et al. Cancer Res. 2009 Nov 15;69(22):8620-8. doi: 10.1158/0008-5472.CAN-09-1591. Epub 2009 Nov 3. Cancer Res. 2009. PMID: 19887601 - beta1 integrin as a molecular therapeutic target.
Cordes N, Park CC. Cordes N, et al. Int J Radiat Biol. 2007 Nov-Dec;83(11-12):753-60. doi: 10.1080/09553000701639694. Int J Radiat Biol. 2007. PMID: 18058364 Review. - beta1 integrin targeting to enhance radiation therapy.
Nam JM, Chung Y, Hsu HC, Park CC. Nam JM, et al. Int J Radiat Biol. 2009 Nov;85(11):923-8. doi: 10.3109/09553000903232876. Int J Radiat Biol. 2009. PMID: 19895268 Review.
Cited by
- Targeting constitutively activated β1 integrins inhibits prostate cancer metastasis.
Lee YC, Jin JK, Cheng CJ, Huang CF, Song JH, Huang M, Brown WS, Zhang S, Yu-Lee LY, Yeh ET, McIntyre BW, Logothetis CJ, Gallick GE, Lin SH. Lee YC, et al. Mol Cancer Res. 2013 Apr;11(4):405-17. doi: 10.1158/1541-7786.MCR-12-0551. Epub 2013 Jan 21. Mol Cancer Res. 2013. PMID: 23339185 Free PMC article. - Real-time cancer detection with an integrated lensless fluorescence contact imager.
Papageorgiou EP, Zhang H, Giverts S, Park C, Boser BE, Anwar M. Papageorgiou EP, et al. Biomed Opt Express. 2018 Jul 9;9(8):3607-3623. doi: 10.1364/BOE.9.003607. eCollection 2018 Aug 1. Biomed Opt Express. 2018. PMID: 30338143 Free PMC article. - T-DM1-resistant cells gain high invasive activity via EGFR and integrin cooperated pathways.
Endo Y, Shen Y, Youssef LA, Mohan N, Wu WJ. Endo Y, et al. MAbs. 2018 Oct;10(7):1003-1017. doi: 10.1080/19420862.2018.1503904. Epub 2018 Sep 11. MAbs. 2018. PMID: 30130447 Free PMC article. - Three-dimensional collagen represses cyclin E1 via β1 integrin in invasive breast cancer cells.
Wu Y, Guo X, Brandt Y, Hathaway HJ, Hartley RS. Wu Y, et al. Breast Cancer Res Treat. 2011 Jun;127(2):397-406. doi: 10.1007/s10549-010-1013-x. Epub 2010 Jul 4. Breast Cancer Res Treat. 2011. PMID: 20607601 Free PMC article. - Beta1 integrins mediate cell proliferation in three-dimensional cultures by regulating expression of the sonic hedgehog effector protein, GLI1.
Goel HL, Underwood JM, Nickerson JA, Hsieh CC, Languino LR. Goel HL, et al. J Cell Physiol. 2010 Jul;224(1):210-7. doi: 10.1002/jcp.22116. J Cell Physiol. 2010. PMID: 20333644 Free PMC article.
References
- Mendelsohn J, Baselga J. The EGF receptor family as targets for cancer therapy. Oncogene. 2000;19:6550–6565. - PubMed
- Slamon DJ, Leyland-Jones B, Shak S, et al. Use of chemotherapy plus a monoclonal antibody against HER2 for metastatic breast cancer that overexpresses HER2. N Engl J Med. 2001;344:783–792. - PubMed
- Giancotti FG, Ruoslahti E. Integrin signaling. Science. 1999;285:1028–1032. - PubMed
- White DE, Kurpios NA, Zuo D, et al. Targeted disruption of β1-integrin in a transgenic mouse model of human breast cancer reveals an essential role in mammary tumor induction. Cancer Cell. 2004;6:159–170. - PubMed
- Berry MG, Gui GP, Wells CA, Carpenter R. Integrin expression and survival in human breast cancer. Eur J Surg Oncol. 2004;30:484–489. - PubMed
Publication types
MeSH terms
Substances
Grants and funding
- CA 64786-09/CA/NCI NIH HHS/United States
- R37 CA064786/CA/NCI NIH HHS/United States
- P50 CA 58207-08/CA/NCI NIH HHS/United States
- R01 CA124891/CA/NCI NIH HHS/United States
- U54 CA112970-01/CA/NCI NIH HHS/United States
- R01 CA064786-09/CA/NCI NIH HHS/United States
- P50 CA058207/CA/NCI NIH HHS/United States
- U54 CA112970/CA/NCI NIH HHS/United States
- P50 CA 112970-01/CA/NCI NIH HHS/United States
- R01 CA064786/CA/NCI NIH HHS/United States
LinkOut - more resources
Full Text Sources
Other Literature Sources
Medical
Miscellaneous
