Retinoid-related orphan receptor alpha controls the early steps of Purkinje cell dendritic differentiation - PubMed (original) (raw)
Retinoid-related orphan receptor alpha controls the early steps of Purkinje cell dendritic differentiation
Fatiha Boukhtouche et al. J Neurosci. 2006.
Abstract
Dendritic differentiation involves both regressive and growth events. The mechanisms controlling the regressive events are poorly understood. This study is aimed at determining the role of the nuclear receptor retinoid-related orphan receptor alpha (RORalpha) in Purkinje cell (PC) dendritic differentiation in organotypic cultures. As observed in vivo, in these cultures, fusiform PCs with embryonic bipolar shape undergo regression before the outgrowth of the ultimate dendritic tree. We show that lentiviral-mediated hRORalpha1 overexpression in fusiform PCs leads to a cell-autonomous accelerated progression of dendritic differentiation. In addition, RORalpha is necessary for the PC regressive events: whereas staggerer RORalpha-deficient PCs remain in the embryonic fusiform stage, replacement of hRORalpha1 restores normal dendritogenesis. These results demonstrate that RORalpha expression in fusiform PCs is crucial for the dendritic regression and progression of the following step of extension of dendritic processes. However, it does not seem to participate to the last stage of dendritic growth. This study identifies RORalpha as a nuclear receptor crucial for the control of dendritic remodeling during development.
Figures
Figure 1.
Classification of PC differentiation stages in organotypic cultures. CaBP-immunolabeled PCs from slices cultured at P0 and maintained in culture for 3 d (A), 7 d (B), 10 d (C) or 14 d (D).A, Fusiform PCs with a bipolar shape are defined as stage I. B, PCs with regressive-atrophic dendrites all around the soma are defined as stage II.C, PC with one or more perisomatic protrusions is defined as stage III. D, PC with identified dendritic tree is classified in stage IV. Scale bar, 20 μm.
Figure 2.
Lentiviral-mediated transduction in organotypic cerebellar cultures. P0 plus 7 DIV cultured cerebellar slices at low (4×) magnification (A–C) or at higher (20×) magnification (D–I) infected with Lenti-GFP (A–F) or with Lenti-hRORα1 (G–I) vectors.A–F, PCs are visualized with PC-specific CaBP immunolabeling in red (A,C and D,F), and Lenti-GFP-transduced PCs are revealed by green GFP expression (B, C and**E, F). GFP-expressing PCs appear as yellow cells in merged images (C, F). InC** and F, white arrows indicate PCs nontransduced by the Lenti-GFP vector, and open arrows indicate non-PC GFP-expressing cells. G–I, PCs revealed in red (G, I), and RORα-expressing cells are immunolabeled in green (H, I). hRORα1-overexpressing PCs appear as red cells with intense yellow nuclei in the merged image (I). In H, arrowheads indicate Lenti-hRORα1-transduced cells with intense RORα immunolabeling, whereas the double-crossed arrow shows the weak intensity of RORα immunolabeling in a cell with endogenous RORα expression. Scale bars:A–C, 100 μm;D–I, 20 μm.
Figure 3.
hRORα1 overexpression accelerates dendritic differentiation. Images of PCs in organotypic cultures at E17 plus 7 DIV (A–C), P0 plus 3 DIV PCs (E, F), P0 plus 5 DIV (H–J), and P0 plus 7 DIV PCs (L–N), revealed with CaBP immunolabeling. Slices were infected with either Lenti-GFP (A, E,H, L) or Lenti-hRORα1 (B,C, F,I, J,M, N) vectors. Transduced PCs were identified by GFP expression for Lenti-GFP or by RORα immunolabeling for Lenti-hRORα1 cultures. Note the presence of more mature hRORα1-overexpressing PCs compared with Lenti-GFP-expressing PCs.C, J,N, High-magnification view of dendrites of stage IV PCs at E17 plus 7 DIV, P0 plus 5 DIV, and P0 plus 7 DIV, showing filopodia (arrows) and spine-like structures (arrowheads). D,G, K,O, Quantitative distribution of PCs between stages I to IV (stages are defined in Fig. 1). For all culture times, the PCs undergo an accelerated differentiation when hRORα1 is overexpressed. Scale bars: A,B, E,F, H,I, L,M, 25 μm (magnification, 20×);C, J,N, 5 μm (magnification, 100×).
Figure 4.
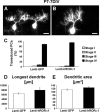
hRORα1 overexpression does not influence late dendritic differentiation. PCs stained by CaBP immunolabeling in organotypic cultures of P7 cerebellar slices kept 7 d in vitro. Transduced PCs were identified by GFP expression for Lenti-GFP-infected slices (A) and by RORα nuclear immunolabeling for Lenti-hRORα1-infected slices (B): these PCs display a similar identified dendritic tree. C, The mean ± SD values of the percentage of PCs in each stage show that both GFP-expressing and hRORα1-overexpressing PCs are almost all in stage IV (stages are defined in Fig. 1). D,E, Quantitative evaluation of the morphological parameters of both GFP-expressing and hRORα1-overexpressing PCs. The longest dendrite (D) and the total dendritic tree area (E) were measured. The mean longest dendrite and the mean dendritic tree area are similar in GFP-expressing PCs and in hRORα1-overexpressing PCs. Data represent mean ± SD of at least 50 transduced PCs investigated in three independent experiments (longest dendrite,p = 0.08; dendritic area, p = 0.12; Student’s t test).
Figure 5.
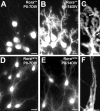
RORα-deficient staggerer PCs fail to regress from their bipolar morphology. PCs in organotypic cultures from wild-type (A–C) or staggerer Rora sg/sg (D–F) P0 mice, revealed by CaBP immunolabeling after 7 DIV (A,D) or 14 DIV (B,C, E,F). Wild-type PCs undergo normal differentiation: they are in stage II (PCs with regressive-atrophic dendrites) after 7 DIV and in stage IV (PCs with identified dendritic tree) after 14 DIV, with the emergence of dendrite spine-like structures (arrows in C).Rora sg/sg PCs remain in the embryonic fusiform shape (stage I) after 7 DIV (D) and 14 DIV (E) and display smooth dendrites devoid of spines (F). Scale bars: A,B, D,E, 20 μm (magnification, 20×);C, F, 5 μm (magnification, 100×).
Figure 6.
hRORα1 replacement in staggerer PCs restores a normal dendritic differentiation. Organotypic cultures from_Rora_ sg/sg (A–E) or wild-type (F–J) P0 mice after 7 DIV, infected either with Lenti-GFP (A, B,F, G) or with Lenti-hRORα1 (C–E,H–J). PCs are visualized with CaBP immunolabeling in red (B, D,G, I), whereas Lenti-GFP-transduced PCs are revealed by the green GFP expression (A,F), and hRORα1-overexpressing PCs are identified by the high intensity of the RORα immunolabeling in green (arrows in**C, H) compared with the low intensity in nontransduced PCs with the endogenous RORα expression level (double-crossed arrow in H). Control_Rora_ sg/sg PCs remain fusiform (A, B), whereas hRORα1-overexpressing PCs present elaborate dendritic trees (C, D). Similar to Figure 3, control PCs with endogenous RORα expression present a stellate form (F,G, and double-crossed arrow inH, I), whereas hRORα1-overexpressing wild-type PCs have identified dendritic trees (arrow inH, I). Both hRORα1-overexpressing Rora+/+ and_Rora_ sg/sg PCs develop spine-like structures (arrowheads in E, J). Scale bars: A–D,F–I, 20 μm (magnification, 20×);E**, J, 5 μm (magnification, 100×).
Similar articles
- Induction of early Purkinje cell dendritic differentiation by thyroid hormone requires RORα.
Boukhtouche F, Brugg B, Wehrlé R, Bois-Joyeux B, Danan JL, Dusart I, Mariani J. Boukhtouche F, et al. Neural Dev. 2010 Jul 27;5:18. doi: 10.1186/1749-8104-5-18. Neural Dev. 2010. PMID: 20663205 Free PMC article. - RORα Regulates Multiple Aspects of Dendrite Development in Cerebellar Purkinje Cells In Vivo.
Takeo YH, Kakegawa W, Miura E, Yuzaki M. Takeo YH, et al. J Neurosci. 2015 Sep 9;35(36):12518-34. doi: 10.1523/JNEUROSCI.0075-15.2015. J Neurosci. 2015. PMID: 26354918 Free PMC article. - Plasticity of the developmentally arrested staggerer cerebellum in response to exogenous RORα.
Iizuka A, Matsuzaki Y, Konno A, Hirai H. Iizuka A, et al. Brain Struct Funct. 2016 Jul;221(6):2879-89. doi: 10.1007/s00429-015-1077-9. Epub 2015 Jun 30. Brain Struct Funct. 2016. PMID: 26122696 - The ROR nuclear orphan receptor subfamily: critical regulators of multiple biological processes.
Jetten AM, Kurebayashi S, Ueda E. Jetten AM, et al. Prog Nucleic Acid Res Mol Biol. 2001;69:205-47. doi: 10.1016/s0079-6603(01)69048-2. Prog Nucleic Acid Res Mol Biol. 2001. PMID: 11550795 Review. - RORalpha, a pivotal nuclear receptor for Purkinje neuron survival and differentiation: from development to ageing.
Boukhtouche F, Doulazmi M, Frederic F, Dusart I, Brugg B, Mariani J. Boukhtouche F, et al. Cerebellum. 2006;5(2):97-104. doi: 10.1080/14734220600750184. Cerebellum. 2006. PMID: 16818384 Review.
Cited by
- Interaction between retinoid acid receptor-related orphan receptor alpha (RORA) and neuropeptide S receptor 1 (NPSR1) in asthma.
Acevedo N, Sääf A, Söderhäll C, Melén E, Mandelin J, Pietras CO, Ezer S, Karisola P, Vendelin J, Gennäs GB, Yli-Kauhaluoma J, Alenius H, von Mutius E, Doekes G, Braun-Fahrländer C, Riedler J, van Hage M, D'Amato M, Scheynius A, Pershagen G, Kere J, Pulkkinen V. Acevedo N, et al. PLoS One. 2013;8(4):e60111. doi: 10.1371/journal.pone.0060111. Epub 2013 Apr 2. PLoS One. 2013. PMID: 23565190 Free PMC article. - Purkinje cell maturation participates in the control of oligodendrocyte differentiation: role of sonic hedgehog and vitronectin.
Bouslama-Oueghlani L, Wehrlé R, Doulazmi M, Chen XR, Jaudon F, Lemaigre-Dubreuil Y, Rivals I, Sotelo C, Dusart I. Bouslama-Oueghlani L, et al. PLoS One. 2012;7(11):e49015. doi: 10.1371/journal.pone.0049015. Epub 2012 Nov 14. PLoS One. 2012. PMID: 23155445 Free PMC article. - Dendrite formation of cerebellar Purkinje cells.
Tanaka M. Tanaka M. Neurochem Res. 2009 Dec;34(12):2078-88. doi: 10.1007/s11064-009-0073-y. Epub 2009 Oct 10. Neurochem Res. 2009. PMID: 19821027 Review. - Tis21 knock-out enhances the frequency of medulloblastoma in Patched1 heterozygous mice by inhibiting the Cxcl3-dependent migration of cerebellar neurons.
Farioli-Vecchioli S, Cinà I, Ceccarelli M, Micheli L, Leonardi L, Ciotti MT, De Bardi M, Di Rocco C, Pallini R, Cavallaro S, Tirone F. Farioli-Vecchioli S, et al. J Neurosci. 2012 Oct 31;32(44):15547-64. doi: 10.1523/JNEUROSCI.0412-12.2012. J Neurosci. 2012. PMID: 23115191 Free PMC article. - Profound morphological and functional changes of rodent Purkinje cells between the first and the second postnatal weeks: a metamorphosis?
Dusart I, Flamant F. Dusart I, et al. Front Neuroanat. 2012 Apr 11;6:11. doi: 10.3389/fnana.2012.00011. eCollection 2012. Front Neuroanat. 2012. PMID: 22514522 Free PMC article.
References
- Alisky JM, Hughes SM, Sauter SL, Jolly D, Dubensky TW Jr, Staber PD, Chiorini JA, Davidson BL (2000). Transduction of murine cerebellar neurons with recombinant FIV and AAV5 vectors. NeuroReport 11:2669–2673. - PubMed
- Armengol JA, Sotelo C (1991). Early dendritic development of Purkinje cells in the rat cerebellum. A light and electron microscopic study using axonal tracing in “in vitro” slices. Brain Res Dev Brain Res 64:95–114. - PubMed
- Atkins GB, Hu X, Guenther MG, Rachez C, Freedman LP, Lazar MA (1999). Coactivators for the orphan nuclear receptor RORalpha. Mol Endocrinol 13:1550–1557. - PubMed
- Baptista CA, Hatten ME, Blazeski R, Mason CA (1994). Cell-cell interactions influence survival and differentiation of purified Purkinje cells in vitro. Neuron 12:243–260. - PubMed
- Bottjer SW, Arnold AP (1997). Developmental plasticity in neural circuits for a learned behavior. Annu Rev Neurosci 20:459–481. - PubMed
Publication types
MeSH terms
Substances
LinkOut - more resources
Full Text Sources
Other Literature Sources
Research Materials


