p16(INK4a) prevents centrosome dysfunction and genomic instability in primary cells - PubMed (original) (raw)
p16(INK4a) prevents centrosome dysfunction and genomic instability in primary cells
Kimberly M McDermott et al. PLoS Biol. 2006 Mar.
Abstract
Aneuploidy, frequently observed in premalignant lesions, disrupts gene dosage and contributes to neoplastic progression. Theodor Boveri hypothesized nearly 100 years ago that aneuploidy was due to an increase in centrosome number (multipolar mitoses) and the resultant abnormal segregation of chromosomes. We performed immunocytochemistry, quantitative immunofluorescence, karyotypic analysis, and time-lapse microscopy on primary human diploid epithelial cells and fibroblasts to better understand the mechanism involved in the production of supernumerary centrosomes (more than two microtubule nucleating bodies) to directly demonstrate that the presence of supernumerary centrosomes in genomically intact cells generates aneuploid daughter cells. We show that loss of p16(INK4a) generates supernumerary centrosomes through centriole pair splitting. Generation of supernumerary centrosomes in human diploid epithelial cells was shown to nucleate multipolar spindles and directly drive production of aneuploid daughter cells as a result of unequal segregation of the genomic material during mitosis. Finally, we demonstrate that p16(INK4a) cooperates with p21 through regulation of cyclin-dependent kinase activity to prevent centriole pair splitting. Cells with loss of p16(INK4a) activity have been found in vivo in histologically normal mammary tissue from a substantial fraction of healthy, disease-free women. Demonstration of centrosome dysfunction in cells due to loss of p16(INK4a) suggests that, under the appropriate conditions, these cells can become aneuploid. Gain or loss of genomic material (aneuploidy) may provide the necessary proproliferation and antiapoptotic mechanisms needed for the earliest stages of tumorigenesis.
Figures
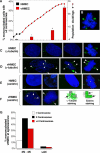
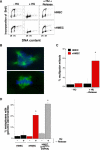
Figure 1. vHMECs Accumulate Mitotic and Centrosome Abnormalities
(A) The solid line graph represents the in vitro growth curves of both HMECs (black circles) and vHMECs (red squares) isolated from RM16. The bar graph represents analysis of mononucleated cells containing more than two centrosomes. Centrosome number was determined by immunocytochemistry with an antibody recognizing the centrosome-associated γ-tubulin protein (excluding multinucleated cells). Cells were analyzed at multiple points along the growth curves of two different individuals (RM9 and RM16). HMEC (black) (RM9 and RM16 [less than five PD]) and vHMECs (red) analyzed at early-passage (RM9 [14 PD] and RM16 [20 PD]), late-passage (RM9 [43 PD], RM9 [65 PD]), and the agonescence (RM9 [70 PD] and RM16 [50 PD]). *Statistical significance (p < 0.005) based on comparison of HMECs to vHMECs. (B) Example of a late-passage vHMEC with a tripolar mitotic metaphase. Examples of centrosomes of HMECs (C and E) and vHMECs (D and F) detected by immunocytochemistry with antibodies recognizing the centrosome-associated γ-tubulin (C and D) and centrin (E and F) proteins. Examples of HMECs representing normal centrosomes during the G1 phase of the cell cycle (C and E, first panel), during the S and G2 phases of the cell cycle (C and E, second panel), during the M phase with centrosomes migrating to opposite poles of the cell (C and E, third and fourth panels), and vHMECs containing cells with more than two centrosomes (D and F, arrowhead). (G) Agonescent vHMECs (RM16 [47 and 50 PD]) were stained with an antibody recognizing γ-tubulin and with PI (DNA counterstain), and the DNA content of each nucleus was measured by quantitative immunofluorescence microscopy. Cells were classified as having 2N to 4N (diploid) or more than 4N (polyploidy) DNA content. The centrosome number (γ-tubulin signal) of each cell was linked to that individual nucleus. Analysis included 150 to 250 cells.
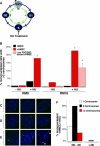
Figure 2. Centrosome Duplication Is Uncoupled from DNA Replication in vHMECs
(A) Schematic of the centrosome duplication cycle (interior, green) in relation to the DNA replication cycle (exterior, blue). Each daughter cell inherits one copy of the DNA and one centrosome (G1 phase of the cell cycle). Centrosomes (small, green circles) begin duplication at the same point as when DNA replication is initiated (S phase of the cell cycle). Following duplication and maturation of the centrosome, the two centrosomes separate and migrate to opposite poles during early M (mitosis). (B) Analysis of mononucleated cells with more than two centrosomes in HMECs (black: RM9 [5 PD], RM16 [less than 4 PD]), early-passage vHMECs (red: RM9 [21 PD], RM16 [7 PD]), and low FSC/SSC sorted vHMECs (blue: RM16 [17 and 30 PD]) untreated (−HU) or exposed to HU (+HU). (C–E) Examples of normal centrosome numbers in HMECs (C) and vHMECs (D) and more than two centrosomes in vHMECs (E). (F) Early-passage vHMECs (RM9 [14 PD] and RM16 [17 PD]) that were exposed to HU were stained with an antibody recognizing γ-tubulin and with PI (DNA counterstain), and the DNA content of each nucleus was measured by quantitative immunofluorescence microscopy. Cells were classified as having 2N to 4N (diploid) or more than 4N (polyploidy) DNA content. The centrosome number of each cell was correlated to the DNA content of that cell. Analysis included 100 to 200 cells (excluding binucleated cells). *Statistical significance (p < 0.005) based on comparison of −HU and +HU experiments.
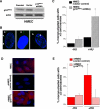
Figure 3. Loss of p16INK4a Uncouples the Centrosome Duplication and DNA Replication Cycles in HMECs
(A) Western blot analysis of p16INK4a expression in HMECs parental, infected with vector-only (vector), or shRNA directed against p16INK4a (p16INK4a shRNA). (B, arrowhead) Examples of more than two centrosomes in HU-exposed HMECs (p16INK4a shRNA). (C) HMECs infected with vector-only (black: RM9 [6 and 7 PD]) or p16INK4a shRNA (gray: RM9 [7 and 8 PD]) were untreated (−HU) or exposed to HU (+HU). (D) Expression levels of p16INK4a (red) in HMECs, vHMECs transfected with vector-only or p16INK4a. (E) vHMECs infected with vector-only (red: RM15 [33 to 37 PD]) or p16INK4a (gray: RM15 [33 to 37 PD]) were untreated (−HU) or exposed to HU (+HU). Centrosome number was determined by immunocytochemistry with an antibody recognizing the centrosome-associated γ-tubulin protein. Analysis included at least 100 cells. *Statistical significance (p < 0.005) based on comparison of −HU and +HU experiments.
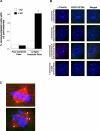
Figure 4. Generation of More Than Two Centrosomes in vHMECs following S Phase Arrest Is Due to Centriole Pair Splitting
(A and B) Analysis of the centriole number in of the supernumerary centrosomes of early-passage vHMECs (RM15 [19 PD]) that express EGFP-CETN2 (centriole marker, green) untreated (−HU) or exposed to HU (+HU). Centrosome number was determined by immunocytochemistry with an antibody recognizing the centrosome-associated γ-tubulin protein (centrosome marker, red). Analysis included at least 100 cells (excluding binucleated cells). *Statistical significance (p < 0.005) based on comparison of −HU and +HU experiments. (B) Examples of HU-exposed vHMECs with one centrosome (containing a pair of centrioles), two centrosomes (each containing one centriole), three centrosomes (one of the centrosomes contains a pair of centrioles and two of the centrosomes have only one centriole), and four centrosomes (each containing one centriole). (C) Examples of HU-exposed and released vHMECs that express EGFP-CETN2 (green) and have been stained with a γ-tubulin antibody that recognizes microtubule spindles (red) that have two centrosomes, each containing two centriole (top), and supernumerary centrosomes, each containing one centriole (bottom). Supernumerary centrosomes with one centriole (arrowhead) can nucleate microtubules to form a multipolar spindle apparatus.
Figure 5. Supernumerary Centrosomes Produce Multipolar Spindles and Correlate with Aneuploidy
(A) BrdU incorporation of HMECs (top) and vHMECs (bottom). Cell cycle analysis were performed using BrdU incorporation for cells that were untreated (−HU), treated for 48 h with HU (+HU), or treated for 48 h with HU, followed by release from HU treatment for 7 to 8 d (+HU → release). DNA replication resumes following release from 48 h of HU treatment. (B) Microtubule nucleation sites were determined by immunocytochemistry with an antibody recognizing γ-tubulin. (C) Analysis of HMECs (black: RM9 and RM26 [less than 4 PD]) and vHMECs (red: RM15 [25 PD], RM16 [13 PD]) for multipolar mitosis in untreated (−HU) or exposed to HU followed by release from HU treatment (+HU → release). (D) Analysis of HMECs (black: RM9 and RM15 [less than 5 PD]) and vHMECs (red: RM9 [21 PD], RM16 [17 PD]), HMECs infected with p16INK4a shRNA (gray) for genomic abnormalities in untreated (−HU) or exposed to HU followed by release from HU treatment (+HU → release). Types of chromosomal abnormalities represented include aneuploidy, structural abnormalities, and telomeric associations. Analysis included at least 100 metaphases. *Statistical significance (p < 0.005) based on comparison of −HU and +HU → release experiments.
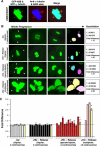
Figure 6. Supernumerary Centrosomes Play a Causal Role in the Production of Aneuploid Cells
(A) Early-passage vHMECs (RM18, 13–33 PD) that express EGFP–γ-tubulin (green) and EGFP-H2B (green) were stained with antibody recognizing the centrosome associated γ-tubulin protein (red) and with DAPI to localize DNA (blue). The merged image demonstrates colocalization of EGFP–γ-tubulin with the centrosome and EGFP-H2B with the DNA. (B) Examples of the mitotic progression of cells that divide into two nuclei with two centrosomes (−HU and +HU → release; bipolar, two centrosomes), that divide into two nuclei with more than two centrosomes (+HU → release; bipolar, more than two centrosomes), and that divide into greater than two nuclei with more than two centrosomes (+HU → release; multipolar, with more than two centrosomes). Arrowhead points to the EGFP–γ-tubulin signal (centrosomes). The EGFP-H2B signal was selected (pastel-colored nuclei) and the total signal intensity was quantitated. Determining the fold difference (EGFP-H2B signal intensity of daughter cells 1/EGFP-H2B signal intensity of daughter cells 2) allowed us to determine whether cells had segregated their DNA equally (fold difference close to 1.00) or unequally (fold difference >1.00). (C) Bar graph of the individual (white, black, red, and red stripe) and mean (yellow) fold differences in EGFP-H2B signals intensity between daughter cells. Standard deviations represent analysis of up to ten time frames per mitotic event. The dashed line represents the average mean fold difference (1.08) of the normal mitosis (−HU and +HU → release; bipolar, two centrosomes). *Statistical significance (p < 0.05) based on comparison of the mean fold difference (yellow bars) of cells completing mitosis with two centrosomes (−HU and +HU → release; bipolar, two centrosomes) compared to the individual and mean fold differences of cells completing mitosis with more than two centrosomes (+HU → release; bipolar or multipolar, more than two centrosomes).
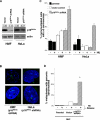
Figure 7. Loss of p16INK4a Results in Centrosome Dysfunction and the Subsequent Generation of Aneuploid HMF and HeLa Cells
(A) Western blot analysis of p16INK4a expression in HMF and HeLa cells infected with vector-only (vector) or shRNA directed against p16INK4a (p16INK4a shRNA). (B) Examples of more than two centrosomes in HMF (p16INK4a shRNA) and HeLa (p16INK4a shRNA) cells. Centrosome number was determined by immunocytochemistry with an antibody recognizing the centrosome-associated γ-tubulin protein. (C) Analysis of parental HMF (RM9 [1 PD], RM21 [3 PD]) and HeLa cells (black) and HMF and HeLa cells infected with vector-only (HMF: RM9 [7 PD], RM21 [11 PD]) (white) or HMF and HeLa cells infected with p16INK4a shRNA (HMF: RM9 [6 PD], RM21 [7 PD]) (gray) containing mononucleated cells with more than two centrosomes. Cells were untreated (−HU) or exposed to HU (+HU). Analysis included more than two HMF and HeLa cells. *Statistical significance (p < 0.005) based on comparison of −HU and +HU experiments.
Figure 8. Unregulated Kinase Activity Is Responsible for the Uncoupling of the Centrosome Duplication and DNA Replication Cycles
(A and B) vHMECs (RM9 [17 PD], RM16 [20 PD]) that were untreated (−HU) or treated for 6, 12, 24, 36, and 48 h with HU (+HU) were analyzed by (A) flow cytometry of PI and BrdU incorporation (% cells arrested in S phase) and (B) confocal microscopy for mononucleated cells with more than two centrosomes. The kinase inhibitors purvalanol A (Pur) and roscovitine (Rosc) were added following the addition of HU for 36 h and incubated in the presence of HU for 12 h (B). (C) Fibroblasts that express p21 (p21+/+) and that have p21 knocked out (p21−/−) were analyzed by confocal microscopy for mononucleated cells with more than two centrosomes. Centrosome number was determined by immunocytochemistry with an antibody recognizing the centrosome associated γ-tubulin protein. Centrosome number analysis included at least 200 cells per sample (excluding binucleated cells). *Statistical significance (p < 0.005) based on comparison of −HU and +HU experiments. (D) Model of two mechanisms by which p16INK4a can mediate Cdk2 activity. The p16INK4a protein inhibits the G1 kinase activity of the cyclinD1-Cdk4 complex by binding to Cdk4 and preventing its association with cyclinD1, thereby preventing transcriptional activation of the Cdk2 binding partners cyclin E/A (Mechanism 1). The p21 kinase inhibitor is required for assembly of and stabilization of the cyclinD1-Cdk4 complex. In the presence of p16INK4a, the cyclinD1-Cdk4 complex is disrupted, causing p21 to be released. When p21 accumulates to a critical threshold, it can bind to and inhibit the late G1 and S phase kinase activity of the cylinE/A-Cdk2 complex (Mechanism 2).
Comment in
- A key tumor suppressor protein ensures proper chromosome segregation during cell division.
Hoff M. Hoff M. PLoS Biol. 2006 Mar;4(3):e65. doi: 10.1371/journal.pbio.0040065. Epub 2006 Feb 14. PLoS Biol. 2006. PMID: 20076537 Free PMC article. No abstract available.
Similar articles
- Centrosome aberrations and cancer.
Krämer A, Ho AD. Krämer A, et al. Onkologie. 2001 Dec;24(6):538-44. doi: 10.1159/000055141. Onkologie. 2001. PMID: 11799308 Review. - Deregulation of the centrosome cycle and the origin of chromosomal instability in cancer.
Lingle WL, Lukasiewicz K, Salisbury JL. Lingle WL, et al. Adv Exp Med Biol. 2005;570:393-421. doi: 10.1007/1-4020-3764-3_14. Adv Exp Med Biol. 2005. PMID: 18727509 Review. - Centrosome replication, genomic instability and cancer.
Krämer A, Neben K, Ho AD. Krämer A, et al. Leukemia. 2002 May;16(5):767-75. doi: 10.1038/sj.leu.2402454. Leukemia. 2002. PMID: 11986936 Review. - Centrosome aberrations in human mammary epithelial cells driven by cooperative interactions between p16INK4a deficiency and telomere-dependent genotoxic stress.
Domínguez D, Feijoo P, Bernal A, Ercilla A, Agell N, Genescà A, Tusell L. Domínguez D, et al. Oncotarget. 2015 Sep 29;6(29):28238-56. doi: 10.18632/oncotarget.4958. Oncotarget. 2015. PMID: 26318587 Free PMC article. - Loss of Both CDKN2A and CDKN2B Allows for Centrosome Overduplication in Melanoma.
Patel S, Wilkinson CJ, Sviderskaya EV. Patel S, et al. J Invest Dermatol. 2020 Sep;140(9):1837-1846.e1. doi: 10.1016/j.jid.2020.01.024. Epub 2020 Feb 15. J Invest Dermatol. 2020. PMID: 32067956 Free PMC article.
Cited by
- RNA polymerase II transcription is required for human papillomavirus type 16 E7- and hydroxyurea-induced centriole overduplication.
Duensing A, Liu Y, Spardy N, Bartoli K, Tseng M, Kwon JA, Teng X, Duensing S. Duensing A, et al. Oncogene. 2007 Jan 11;26(2):215-23. doi: 10.1038/sj.onc.1209782. Epub 2006 Jul 3. Oncogene. 2007. PMID: 16819507 Free PMC article. - P53, cyclin-dependent kinase and abnormal amplification of centrosomes.
Fukasawa K. Fukasawa K. Biochim Biophys Acta. 2008 Sep;1786(1):15-23. doi: 10.1016/j.bbcan.2008.04.002. Epub 2008 Apr 22. Biochim Biophys Acta. 2008. PMID: 18472015 Free PMC article. Review. - Integrative post-genome-wide association analysis of CDKN2A and TP53 SNPs and risk of esophageal adenocarcinoma.
Buas MF, Levine DM, Makar KW, Utsugi H, Onstad L, Li X, Galipeau PC, Shaheen NJ, Hardie LJ, Romero Y, Bernstein L, Gammon MD, Casson AG, Bird NC, Risch HA, Ye W, Liu G, Corley DA, Blount PL, Fitzgerald RC, Whiteman DC, Wu AH, Reid BJ, Vaughan TL. Buas MF, et al. Carcinogenesis. 2014 Dec;35(12):2740-7. doi: 10.1093/carcin/bgu207. Epub 2014 Oct 3. Carcinogenesis. 2014. PMID: 25280564 Free PMC article. - Spontaneously immortalised bovine mammary epithelial cells exhibit a distinct gene expression pattern from the breast cancer cells.
Zhao C, Meng L, Hu H, Wang X, Shi F, Wang Y, Li Q, Lin A. Zhao C, et al. BMC Cell Biol. 2010 Oct 22;11:82. doi: 10.1186/1471-2121-11-82. BMC Cell Biol. 2010. PMID: 20969773 Free PMC article. - Efficient immortalization of primary human cells by p16INK4a-specific short hairpin RNA or Bmi-1, combined with introduction of hTERT.
Haga K, Ohno S, Yugawa T, Narisawa-Saito M, Fujita M, Sakamoto M, Galloway DA, Kiyono T. Haga K, et al. Cancer Sci. 2007 Feb;98(2):147-54. doi: 10.1111/j.1349-7006.2006.00373.x. Cancer Sci. 2007. PMID: 17233832 Free PMC article.
References
- Deng G, Lu Y, Zlotnikov G, Thor AD, Smith HS. Loss of heterozygosity in normal tissue adjacent to breast carcinomas. Science. 1996;274:2057–2059. - PubMed
- Lakhani SR, Chaggar R, Davies S, Jones C, Collins N, et al. Genetic alterations in ‘normal' luminal and myoepithelial cells of the breast. J Pathol. 1999;189:496–503. - PubMed
- Li Z, Moore DH, Meng ZH, Ljung BM, Gray JW, et al. Increased risk of local recurrence is associated with allelic loss in normal lobules of breast cancer patients. Cancer Res. 2002;62:1000–1003. - PubMed
Publication types
MeSH terms
Substances
LinkOut - more resources
Full Text Sources
Other Literature Sources
