A spectrum of PCSK9 alleles contributes to plasma levels of low-density lipoprotein cholesterol - PubMed (original) (raw)
A spectrum of PCSK9 alleles contributes to plasma levels of low-density lipoprotein cholesterol
Ingrid K Kotowski et al. Am J Hum Genet. 2006 Mar.
Abstract
Selected missense mutations in the proprotein convertase subtilisin/kexin type 9 serine protease gene (PCSK9) cause autosomal dominant hypercholesterolemia, whereas nonsense mutations in the same gene are associated with low plasma levels of low-density lipoprotein cholesterol (LDL-C). Here, DNA sequencing and chip-based oligonucleotide hybridization were used to determine whether other sequence variations in PCSK9 contribute to differences in LDL-C levels. The coding regions of PCSK9 were sequenced in the blacks and whites from the Dallas Heart Study (n=3,543) who had the lowest (<5th percentile) and highest (>95th percentile) plasma levels of LDL-C. Of the 17 missense variants identified, 3 (R46L, L253F, and A443T) were significantly and reproducibly associated with lower plasma levels of LDL-C (reductions ranging from 3.5% to 30%). None of the low-LDL-C variants were associated with increased hepatic triglyceride content, as measured by proton magnetic resonance spectroscopy. This finding is most consistent with the reduction in LDL-C being caused primarily by accelerating LDL clearance, rather than by reduced lipoprotein production. Association studies with 93 noncoding single-nucleotide polymorphisms (SNPs) at the PCSK9 locus identified 3 SNPs associated with modest differences in plasma LDL-C levels. Thus, a spectrum of sequence variations ranging in frequency (from 0.2% to 34%) and magnitude of effect (from a 3% increase to a 49% decrease) contribute to interindividual differences in LDL-C levels. These findings reveal that PCSK9 activity is a major determinant of plasma levels of LDL-C in humans and make it an attractive therapeutic target for LDL-C lowering.
Figures
Figure 1
Nonsynonymous sequence variations in PCSK9 identified in the DHS subjects. PCSK9 contains a 30-aa signal peptide (SP) followed by a prodomain (Pro). The proconvertase undergoes autocatalytic processing to release the 14-kDa prodomain peptide from the amino-terminus (Benjannet et al. 2004). The catalytic domain, which contains the catalytic triad of aspartate (D), histidine (H), and serine (S) as well as a highly conserved asparagine (N), is followed by a carboxy-terminal domain, which contains an _N_-linked glycosylation site. The sites of the nonsynonymous mutations identified in only the high-LDL subjects, in only the low-LDL subjects, or in both groups of the DHS sample are shown. The mutations that are significantly associated with an increase (yellow) or decrease (green) in plasma LDL-C levels in the DHS samples are indicated. Mutations identified initially by Abifadel et al. (2003), Cohen et al. (2005), or Benjannet et al. (2004) are indicated by a superscript A, B, or C, respectively.
Figure 2
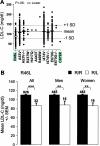
Plasma LDL-C levels in whites in the DHS sample. A, Subjects were genotyped by specific 5′-nucleotidase assay. The mean age- and sex-adjusted plasma LDL-C level of all whites in the DHS sample is indicated by the solid horizontal line (±1 SD is indicated by the dotted lines). Each point in the plot represents the LDL-C level of an individual who is heterozygous or homozygous for the rare allele (−/−) of the indicated sequence variation. Horizontal bars, Mean plasma LDL-C levels for each sequence variant (omitted if
n<6
; see the “Subjects and Methods” section). The green-shaded bar indicates a significantly lower plasma LDL-C level (
P<10-4
, by one-way analysis of variance). B, Mean (± SEM) of the plasma LDL-C levels for the R46L variation. R46L is significantly associated with decreased plasma LDL-C level in the DHS whites (left set of bars), white men (center set of bars), and white women (right set of bars). The number of subjects in each group is given above the bars. **
P<.01
, ***
P<10-4
; by two-sided t test.
Figure 3
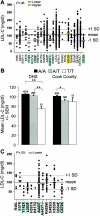
Plasma LDL-C levels in blacks in the DHS (A) and Cook County (C) samples. The mean (solid lines) and SD (dashed lines) of plasma LDL-C levels adjusted for age and sex are shown. Horizontal bars, Mean plasma LDL-C levels for each sequence variant (omitted if
n<6
). Significantly lower or higher plasma LDL-C levels are indicated by green- or yellow-shaded bars, respectively. B, Mean (± SEM) of the plasma LDL-C level at the A443T variation in the DHS blacks (left set of bars) and Cook County subjects (right set of bars). The number of subjects in each group is given above the bars. *
P<.05
, **
P<.01
; by pairwise two-sided t tests with Holm correction for multiple comparisons.
Figure 4
Median HTGC in whites and blacks with nonsynonymous sequence variations in PCSK9 associated with low plasma levels of LDL-C. HTGC was measured using proton magnetic resonance spectroscopy as described elsewhere (Browning et al. 2004). The median HTGC of the whites with or without an LDL-lowering variation (R46L) and the median HTGC of the blacks with or without either a nonsense mutation (Y142X or C679X) or a missense sequence variant (L253F or A443T) associated with a lower level of LDL-C were compared (by two-sided Wilcoxon rank sum test). The number of subjects in each group is given above the bars. The threshold for hepatic steatosis, defined as HTGC >5.5% (Browning et al. 2004), is indicated (arrow).
Figure 5
Evolutionary sequence conservation and predicted functional effects of missense sequence variations in PCSK9. Conservation for each variation found in the low-LDL subjects only (green), the high-LDL subjects only (yellow), or both groups (gray) of the DHS sample and in patients with autosomal dominant hypercholesterolemia (red) (Abifadel et al. ; Leren ; Timms et al. 2004) is highlighted. An asterisk (*) indicates a SNP significantly associated with plasma LDL-C level. Sequences are shown for Homo sapiens, Pan troglodytes, Rhesus macaque, Mus musculus, Rattus norvegicus, Gallus gallus, Xenopus tropicalis, Xenopus laevis, Danio rerio, Fugu rubripes, Tetraodon nigroviridis, and Oryzias latipes. The predicted effect of each amino acid sequence variation on protein function is indicated (right columns). ASIFT v.2: − = tolerated; + = deleterious (low-confidence prediction); ++ = deleterious. BPANTHER v.5.0: − = unlikely functional effect; + = possible deleterious functional effect; ++ = high probability of deleterious functional effect; NA = not modeled by the PANTHER hidden Markov model (family sequence alignment absent or poor). CPolyPhen: − = benign; + = possibly damaging; ++ = probably damaging (Sunyaev et al. ; Ng and Henikoff ; Thomas et al. 2003).
Figure 6
Haplotype block structure across PCSK9 and P values for significance of association of common SNPs with plasma LDL-C level in whites (A) and blacks (B) in the DHS sample. SNPs and haplotype blocks are plotted along the _X_-axis according to genomic position. The P value for each SNP is plotted above or below the midline according to whether the mean plasma LDL-C level of the heterozygous genotype is higher (above midline) or lower (below midline) than the mean plasma LDL-C level of the homozygous common genotype. Coding SNPs significantly associated with plasma LDL-C level are indicated (arrows), and the corresponding amino acid sequence variations are given. Arabic numerals indicate the noncoding SNPs significantly associated with plasma LDL-C level in whites (1) or blacks (1–7). SNPs that were also significant in the Cook County sample are circled. The extents of haplotype blocks are indicated (shaded rectangles). Haplotype blocks significantly associated with plasma LDL-C level are shaded in pink. P values for haplotype blocks are based on the global statistic. Asterisks (*) indicate haplotype blocks that were significantly associated with plasma LDL-C level after exclusion of all SNPs that were individually associated with plasma LDL-C level. Dashed lines,
_P_=.05
. The genomic structure of PCSK9 is shown schematically above the plots. Genomic positions are based on National Center for Biotechnology Information (NCBI) build 34 of the human genome.
Similar articles
- Influence of PCSK9 polymorphisms on plasma lipids and response to atorvastatin treatment in Brazilian subjects.
Anderson JM, Cerda A, Hirata MH, Rodrigues AC, Dorea EL, Bernik MM, Bertolami MC, Faludi AA, Hirata RD. Anderson JM, et al. J Clin Lipidol. 2014 May-Jun;8(3):256-64. doi: 10.1016/j.jacl.2014.02.008. Epub 2014 Mar 5. J Clin Lipidol. 2014. PMID: 24793346 - Genetic variants in PCSK9 in the Japanese population: rare genetic variants in PCSK9 might collectively contribute to plasma LDL cholesterol levels in the general population.
Miyake Y, Kimura R, Kokubo Y, Okayama A, Tomoike H, Yamamura T, Miyata T. Miyake Y, et al. Atherosclerosis. 2008 Jan;196(1):29-36. doi: 10.1016/j.atherosclerosis.2006.12.035. Epub 2007 Feb 21. Atherosclerosis. 2008. PMID: 17316651 - Both rare and common variants in PCSK9 influence plasma low-density lipoprotein cholesterol level in American Indians.
Tsai CW, North KE, Tin A, Haack K, Franceschini N, Saroja Voruganti V, Laston S, Zhang Y, Best LG, MacCluer JW, Beaty TH, Navas-Acien A, Kao WH, Howard BV. Tsai CW, et al. J Clin Endocrinol Metab. 2015 Feb;100(2):E345-9. doi: 10.1210/jc.2014-3340. Epub 2014 Nov 20. J Clin Endocrinol Metab. 2015. PMID: 25412415 Free PMC article. - PCSK9 gene mutations and low-density lipoprotein cholesterol.
Wu NQ, Li JJ. Wu NQ, et al. Clin Chim Acta. 2014 Apr 20;431:148-53. doi: 10.1016/j.cca.2014.01.043. Epub 2014 Feb 8. Clin Chim Acta. 2014. PMID: 24518357 Review. - Proprotein convertase subtilisin/kexin type 9 (PCSK9): from structure-function relation to therapeutic inhibition.
Tibolla G, Norata GD, Artali R, Meneghetti F, Catapano AL. Tibolla G, et al. Nutr Metab Cardiovasc Dis. 2011 Nov;21(11):835-43. doi: 10.1016/j.numecd.2011.06.002. Epub 2011 Sep 23. Nutr Metab Cardiovasc Dis. 2011. PMID: 21943799 Review.
Cited by
- Differential effects of PCSK9 loss of function variants on serum lipid and PCSK9 levels in Caucasian and African Canadian populations.
Mayne J, Ooi TC, Raymond A, Cousins M, Bernier L, Dewpura T, Sirois F, Mbikay M, Davignon J, Chrétien M. Mayne J, et al. Lipids Health Dis. 2013 May 10;12:70. doi: 10.1186/1476-511X-12-70. Lipids Health Dis. 2013. PMID: 23663650 Free PMC article. - Membrane type 1 matrix metalloproteinase promotes LDL receptor shedding and accelerates the development of atherosclerosis.
Alabi A, Xia XD, Gu HM, Wang F, Deng SJ, Yang N, Adijiang A, Douglas DN, Kneteman NM, Xue Y, Chen L, Qin S, Wang G, Zhang DW. Alabi A, et al. Nat Commun. 2021 Mar 25;12(1):1889. doi: 10.1038/s41467-021-22167-3. Nat Commun. 2021. PMID: 33767172 Free PMC article. - Zebrafish small molecule screens: Taking the phenotypic plunge.
Williams CH, Hong CC. Williams CH, et al. Comput Struct Biotechnol J. 2016 Sep 18;14:350-356. doi: 10.1016/j.csbj.2016.09.001. eCollection 2016. Comput Struct Biotechnol J. 2016. PMID: 27721960 Free PMC article. Review. - Detecting rare variants for complex traits using family and unrelated data.
Zhu X, Feng T, Li Y, Lu Q, Elston RC. Zhu X, et al. Genet Epidemiol. 2010 Feb;34(2):171-87. doi: 10.1002/gepi.20449. Genet Epidemiol. 2010. PMID: 19847924 Free PMC article. - A data-adaptive sum test for disease association with multiple common or rare variants.
Han F, Pan W. Han F, et al. Hum Hered. 2010;70(1):42-54. doi: 10.1159/000288704. Epub 2010 Apr 23. Hum Hered. 2010. PMID: 20413981 Free PMC article.
References
Web Resources
- Online Mendelian Inheritance in Man (OMIM), http://www.ncbi.nlm.nih.gov/Omim/ (for LDLR, autosomal dominant hypercholesterolemia, and autosomal recessive hypercholesterolemia)
- Sorting Intolerant From Tolerant (SIFT), http://blocks.fhcrc.org/sift/SIFT.html
- The R Project for Statistical Computing, http://www.r-project.org/
References
- Benjannet S, Rhainds D, Essalmani R, Mayne J, Wickham L, Jin W, Asselin MC, Hamelin J, Varret M, Allard D, Trillard M, Abifadel M, Tebon A, Attie AD, Rader DJ, Boileau C, Brissette L, Chretien M, Prat A, Seidah NG (2004) NARC-1/PCSK9 and its natural mutants: zymogen cleavage and effects on the LDLR and LDL-cholesterol. J Biol Chem 279:48865–4887510.1074/jbc.M409699200 - DOI - PubMed
Publication types
MeSH terms
Substances
LinkOut - more resources
Full Text Sources
Other Literature Sources
Medical
Molecular Biology Databases
Miscellaneous


