Cell-type-specific signatures of microRNAs on target mRNA expression - PubMed (original) (raw)
Cell-type-specific signatures of microRNAs on target mRNA expression
Pranidhi Sood et al. Proc Natl Acad Sci U S A. 2006.
Abstract
Although it is known that the human genome contains hundreds of microRNA (miRNA) genes and that each miRNA can regulate a large number of mRNA targets, the overall effect of miRNAs on mRNA tissue profiles has not been systematically elucidated. Here, we show that predicted human mRNA targets of several highly tissue-specific miRNAs are typically expressed in the same tissue as the miRNA but at significantly lower levels than in tissues where the miRNA is not present. Conversely, highly expressed genes are often enriched in mRNAs that do not have the recognition motifs for the miRNAs expressed in these tissues. Together, our data support the hypothesis that miRNA expression broadly contributes to tissue specificity of mRNA expression in many human tissues. Based on these insights, we apply a computational tool to directly correlate 3' UTR motifs with changes in mRNA levels upon miRNA overexpression or knockdown. We show that this tool can identify functionally important 3' UTR motifs without cross-species comparison.
Conflict of interest statement
Conflict of interest statement: No conflicts declared.
Figures
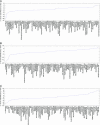
Fig. 1.
Cell-type-specific signatures of miRNAs on target mRNA expression. Shown is analysis of the mRNA expression of predicted targets for three highly tissue-specific miRNAs across 79 human tissues (miR-122, miR-1, and miR-7). Negative values (“scores”; y axis) indicate the significance of predicted miRNA targets to be expressed at lower levels in a tissue relative to all other tissues, compared with a background set of mRNAs (gene-centric analysis; see Methods). Analogously, positive values reflect the significance of miRNA targets to be expressed at high levels compared with other tissues. Tissues are sorted by these scores. Arrows indicate the tissue in which the miRNA is expressed.
Fig. 2.
The enrichment/depletion of predicted miRNA targets in highly/lowly expressed mRNAs is tissue-specific. (A) Number of transcripts predicted to be targeted by miRNAs (y axis) as a function of the top n specifically highly expressed genes (x axis) for three neuronal and four nonneuronal tissues. (B) Analogously, number of transcripts predicted to be targeted by miRNAs as a function of the top n specifically lowly expressed genes for three neuronal and four nonneuronal tissues.
Fig. 3.
The average 3′ UTR length of highly specifically expressed mRNAs is tissue-specific. Shown, for each tissue, is the average 3′ UTR length in nucleotides of the top 200 most highly specifically expressed mRNAs (blue curve). Tissues are sorted by these average 3′ UTR lengths. As a control, the average 3′ UTR lengths of 200 genes that were expressed at average levels in each tissue are also shown (red curve).
Similar articles
- Microarray analysis shows that some microRNAs downregulate large numbers of target mRNAs.
Lim LP, Lau NC, Garrett-Engele P, Grimson A, Schelter JM, Castle J, Bartel DP, Linsley PS, Johnson JM. Lim LP, et al. Nature. 2005 Feb 17;433(7027):769-73. doi: 10.1038/nature03315. Epub 2005 Jan 30. Nature. 2005. PMID: 15685193 - Retained introns increase putative microRNA targets within 3' UTRs of human mRNA.
Tan S, Guo J, Huang Q, Chen X, Li-Ling J, Li Q, Ma F. Tan S, et al. FEBS Lett. 2007 Mar 20;581(6):1081-6. doi: 10.1016/j.febslet.2007.02.009. Epub 2007 Feb 14. FEBS Lett. 2007. PMID: 17320082 - Prediction of microRNA targets.
Mazière P, Enright AJ. Mazière P, et al. Drug Discov Today. 2007 Jun;12(11-12):452-8. doi: 10.1016/j.drudis.2007.04.002. Epub 2007 Apr 26. Drug Discov Today. 2007. PMID: 17532529 Review. - Small but influential: the role of microRNAs on gene regulatory network and 3'UTR evolution.
Zhang R, Su B. Zhang R, et al. J Genet Genomics. 2009 Jan;36(1):1-6. doi: 10.1016/S1673-8527(09)60001-1. J Genet Genomics. 2009. PMID: 19161940 Review. - Target identification of microRNAs expressed highly in human embryonic stem cells.
Li SS, Yu SL, Kao LP, Tsai ZY, Singh S, Chen BZ, Ho BC, Liu YH, Yang PC. Li SS, et al. J Cell Biochem. 2009 Apr 15;106(6):1020-30. doi: 10.1002/jcb.22084. J Cell Biochem. 2009. PMID: 19229866
Cited by
- MicroRNAs in common human diseases.
Li Y, Kowdley KV. Li Y, et al. Genomics Proteomics Bioinformatics. 2012 Oct;10(5):246-53. doi: 10.1016/j.gpb.2012.07.005. Epub 2012 Sep 29. Genomics Proteomics Bioinformatics. 2012. PMID: 23200134 Free PMC article. Review. - MiRBooking simulates the stoichiometric mode of action of microRNAs.
Weill N, Lisi V, Scott N, Dallaire P, Pelloux J, Major F. Weill N, et al. Nucleic Acids Res. 2015 Aug 18;43(14):6730-8. doi: 10.1093/nar/gkv619. Epub 2015 Jun 18. Nucleic Acids Res. 2015. PMID: 26089388 Free PMC article. - MicroRNA in pancreatic cancer: pathological, diagnostic and therapeutic implications.
Rachagani S, Kumar S, Batra SK. Rachagani S, et al. Cancer Lett. 2010 Jun 1;292(1):8-16. doi: 10.1016/j.canlet.2009.11.010. Epub 2009 Dec 9. Cancer Lett. 2010. PMID: 20004512 Free PMC article. Review. - The roles of binding site arrangement and combinatorial targeting in microRNA repression of gene expression.
Hon LS, Zhang Z. Hon LS, et al. Genome Biol. 2007;8(8):R166. doi: 10.1186/gb-2007-8-8-r166. Genome Biol. 2007. PMID: 17697356 Free PMC article. - Regulatory circuit of human microRNA biogenesis.
Lee J, Li Z, Brower-Sinning R, John B. Lee J, et al. PLoS Comput Biol. 2007 Apr 20;3(4):e67. doi: 10.1371/journal.pcbi.0030067. Epub 2007 Feb 27. PLoS Comput Biol. 2007. PMID: 17447837 Free PMC article.
References
- Bartel D. P. Cell. 2004;116:281–297. - PubMed
- Ambros V. Nature. 2004;431:350–355. - PubMed
- Du T., Zamore P. D. Development (Cambridge, U.K.) 2005;132:4645–4652. - PubMed
- Chen C. Z. N. Engl. J. Med. 2005;353:1768–1771. - PubMed
- Krutzfeldt J., Rajewsky N., Braich R., Rajeev K. G., Tuschl T., Manoharan M., Stoffel M. Nature. 2005;438:685–689. - PubMed
Publication types
MeSH terms
Substances
LinkOut - more resources
Full Text Sources
Other Literature Sources


