Nucleic acid visualization with UCSF Chimera - PubMed (original) (raw)
Nucleic acid visualization with UCSF Chimera
Gregory S Couch et al. Nucleic Acids Res. 2006.
Abstract
With the increase in the number of large, 3D, high-resolution nucleic acid structures, particularly of the 30S and 50S ribosomal subunits and the intact bacterial ribosome, advancements in the visualization of nucleic acid structural features are essential. Large molecular structures are complicated and detailed, and one goal of visualization software is to allow the user to simplify the display of some features and accent others. We describe an extension to the UCSF Chimera molecular visualization system for the purpose of displaying and highlighting nucleic acid characteristics, including a new representation of sugar pucker, several options for abstraction of base geometries that emphasize stacking and base pairing, and an adaptation of the ribbon backbone to accommodate the nucleic acid backbone. Molecules are displayed and manipulated interactively, allowing the user to change the representations as desired for small molecules, proteins and nucleic acids. This software is available as part of the UCSF Chimera molecular visualization system and thus is integrated with a suite of existing tools for molecular graphics.
Figures
Figure 1
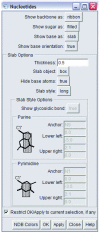
The Nucleotides menu for the nucleic acid visualization tool, showing the many options for the display of the backbone, sugars and bases. Chimera has separate menus for controlling the parameters used for coloring and for drawing ribbons. See
for a detailed description.
Figure 2
Sugar pucker, in the envelope form (red) and twist form (yellow). The envelope form is highlighted using two planes, while the twist form is accented by the drawing of four planes, achieved by the introduction of a non-atom vertex.
Figure 3
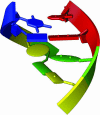
Backbone ribbon representations of B-form DNA (PDB identifier 1bna) (27). In the image on the left, the ribbon is drawn with the C1′ atom, located in the sugar, as the orientation atom and the plane of the ribbon along the sugar. The image on the right shows the new nucleic acid ribbon representation, with the ribbon axis rotated by 90°.
Figure 4
Base representations, including, from top to bottom, filled rings, boxes, ellipsoids and elliptical tubes.
Figure 5
Netropsin bound to double-stranded DNA (28) (PDB identifier 6bna). Each strand of the DNA is colored with the ‘rainbow’ option, with the base colors changing over a range from blue to red from the 5′ to the 3′ end, respectively. The DNA is shown with the backbone represented as a smooth ribbon, the sugars drawn as elliptical tubes and the bases as ellipsoids. Netropsin is colored by element and shown in the ball-and-stick representation, with a transparent pink molecular surface.
Figure 6
The Thermus thermophilus 30S ribosomal subunit (7) (PDB identifier 1j5e). Drawn with the Nucleotides extension and Chimera's MultiScale extension (26), the single-stranded RNA chain is colored with the rainbow option, and the proteins are shown as low-resolution surfaces. From this perspective, the helices appear to be formed from local interactions within the RNA, e.g. red bases pairing with other red bases and green bases pairing with other green bases. Tertiary interactions between the differently colored helices are highlighted as the different colored helices are brought together. Distinct from the other figures, the ribbon representation of the 16S ribosomal RNA has a rounded cross-section, and thus its smooth edges make the orientation of the ribbon less visible.
Figure 7
The Escherichia coli L25 ribosomal protein with 5S ribosomal RNA fragment (29) (PDB identifier 1dfu). Atomic interactions are highlighted between the RNA and the protein by filling the base and sugar rings and leaving the nucleic acid backbone fully represented. The protein is drawn in the stick representation, and the bound metal ions are in yellow. Hydrogen bonds between the RNA and protein were calculated by Chimera and are drawn in yellow.
Similar articles
- Tools for integrated sequence-structure analysis with UCSF Chimera.
Meng EC, Pettersen EF, Couch GS, Huang CC, Ferrin TE. Meng EC, et al. BMC Bioinformatics. 2006 Jul 12;7:339. doi: 10.1186/1471-2105-7-339. BMC Bioinformatics. 2006. PMID: 16836757 Free PMC article. - Web 3DNA--a web server for the analysis, reconstruction, and visualization of three-dimensional nucleic-acid structures.
Zheng G, Lu XJ, Olson WK. Zheng G, et al. Nucleic Acids Res. 2009 Jul;37(Web Server issue):W240-6. doi: 10.1093/nar/gkp358. Epub 2009 May 27. Nucleic Acids Res. 2009. PMID: 19474339 Free PMC article. - Tools for the automatic identification and classification of RNA base pairs.
Yang H, Jossinet F, Leontis N, Chen L, Westbrook J, Berman H, Westhof E. Yang H, et al. Nucleic Acids Res. 2003 Jul 1;31(13):3450-60. doi: 10.1093/nar/gkg529. Nucleic Acids Res. 2003. PMID: 12824344 Free PMC article. - Design and simulation of DNA, RNA and hybrid protein-nucleic acid nanostructures with oxView.
Bohlin J, Matthies M, Poppleton E, Procyk J, Mallya A, Yan H, Šulc P. Bohlin J, et al. Nat Protoc. 2022 Aug;17(8):1762-1788. doi: 10.1038/s41596-022-00688-5. Epub 2022 Jun 6. Nat Protoc. 2022. PMID: 35668321 Review. - Molecular Graphics: Bridging Structural Biologists and Computer Scientists.
Martinez X, Krone M, Alharbi N, Rose AS, Laramee RS, O'Donoghue S, Baaden M, Chavent M. Martinez X, et al. Structure. 2019 Nov 5;27(11):1617-1623. doi: 10.1016/j.str.2019.09.001. Epub 2019 Sep 26. Structure. 2019. PMID: 31564470 Review.
Cited by
- Using NMR and molecular dynamics to link structure and dynamics effects of the universal base 8-aza, 7-deaza, N8 linked adenosine analog.
Spring-Connell AM, Evich MG, Debelak H, Seela F, Germann MW. Spring-Connell AM, et al. Nucleic Acids Res. 2016 Oct 14;44(18):8576-8587. doi: 10.1093/nar/gkw736. Epub 2016 Aug 26. Nucleic Acids Res. 2016. PMID: 27566150 Free PMC article. - Epigenetic TET-Catalyzed Oxidative Products of 5-Methylcytosine Impede Z-DNA Formation of CG Decamers.
Vongsutilers V, Shinohara Y, Kawai G. Vongsutilers V, et al. ACS Omega. 2020 Mar 31;5(14):8056-8064. doi: 10.1021/acsomega.0c00120. eCollection 2020 Apr 14. ACS Omega. 2020. PMID: 32309715 Free PMC article. - Functional interaction between ribosomal protein L6 and RbgA during ribosome assembly.
Gulati M, Jain N, Davis JH, Williamson JR, Britton RA. Gulati M, et al. PLoS Genet. 2014 Oct 16;10(10):e1004694. doi: 10.1371/journal.pgen.1004694. eCollection 2014 Oct. PLoS Genet. 2014. PMID: 25330043 Free PMC article. - UCSF Chimera, MODELLER, and IMP: an integrated modeling system.
Yang Z, Lasker K, Schneidman-Duhovny D, Webb B, Huang CC, Pettersen EF, Goddard TD, Meng EC, Sali A, Ferrin TE. Yang Z, et al. J Struct Biol. 2012 Sep;179(3):269-78. doi: 10.1016/j.jsb.2011.09.006. Epub 2011 Sep 22. J Struct Biol. 2012. PMID: 21963794 Free PMC article. - UCSF ChimeraX: Structure visualization for researchers, educators, and developers.
Pettersen EF, Goddard TD, Huang CC, Meng EC, Couch GS, Croll TI, Morris JH, Ferrin TE. Pettersen EF, et al. Protein Sci. 2021 Jan;30(1):70-82. doi: 10.1002/pro.3943. Epub 2020 Oct 22. Protein Sci. 2021. PMID: 32881101 Free PMC article.
References
- Batey R.T., Gilbert S.D., Montange R.K. Structure of a natural guanine-responsive riboswitch complexed with the metabolite hypoxanthine. Nature. 2004;432:411–415. - PubMed
- Krasilnikov A.S., Yang X., Pan T., Mondragon A. Crystal structure of the specificity domain of ribonuclease P. Nature. 2003;421:760–764. - PubMed
- Krasilnikov A.S., Xiao Y., Pan T., Mondragon A. Basis for structural diversity in homologous RNAs. Science. 2004;306:104–107. - PubMed
- Adams P.L., Stahley M.R., Kosek A.B., Wang J., Strobel S.A. Crystal structure of a self-splicing group I intron with both exons. Nature. 2004;430:45–50. - PubMed


