Hypoxia-induced energy stress regulates mRNA translation and cell growth - PubMed (original) (raw)
Hypoxia-induced energy stress regulates mRNA translation and cell growth
Liping Liu et al. Mol Cell. 2006.
Abstract
Oxygen (O2) deprivation, or hypoxia, has profound effects on cell metabolism and growth. Cells can adapt to low O2 in part through activation of hypoxia-inducible factor (HIF). We report here that hypoxia inhibits mRNA translation by suppressing multiple key regulators, including eIF2alpha, eEF2, and the mammalian target of rapamycin (mTOR) effectors 4EBP1, p70S6K, and rpS6, independent of HIF. Hypoxia results in energy starvation and activation of the AMPK/TSC2/Rheb/mTOR pathway. Hypoxic AMP-activated protein kinase (AMPK) activation also leads to eEF2 inhibition. Moreover, hypoxic effects on cellular bioenergetics and mTOR inhibition increase over time. Mutation of the TSC2 tumor suppressor gene confers a growth advantage to cells by repressing hypoxic mTOR inhibition and hypoxia-induced G1 arrest. Together, eIF2alpha, eEF2, and mTOR inhibition represent important HIF-independent mechanisms of energy conservation that promote survival under low O2 conditions.
Figures
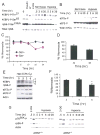
Figure 1. Hypoxia inhibits protein synthesis by rapidly suppressing multiple key regulators of mRNA translation
(A) HEK293 cells were subjected to normoxia (21% O2) or hypoxia (1.5% O2) for 0–20 hr, or treated with insulin, LY294002 (LY), or 2-deoxy-D-glucose (2-DG) for 0.5 hr. Whole cell extracts were analyzed by Western blot for phosphorylation of the indicted residues of 4EBP1 and rpS6. (B) Cell extracts were analyzed for phosphorylation of eIF2α at Ser51 and eEF2 at Thr56. Sample loading was adjusted with total eIF2α protein. (C–D) Serum replete (Ser+) and serum-depleted (Ser−) HEK293 cells were exposed to 21% or 1.5% O2 for 2–48 hr. Protein synthesis was measured by 35S-Met incorporation followed by TCA precipitation. The same samples were also analyzed by gel electrophoresis (see Fig. Supplement 1D and 1E). Results were expressed relative to cells grown under normoxia. Data for serum replete cells are shown in (D). (E) HEK293 cells were grown at 0.3% O2 for 0–6 hr and phosphorylation of 4EBP1, rpS6, eIF2α, and eEF2 was examined. 4EBP1 hypophosphorylation is indicated by its shift from the hyperphosphorylated γ and β forms to the less phosphorylated α form. (F) Protein synthesis for serum replete HEK293 cells grown at 0.3% O2 is shown. (G) Hypoxic mTOR inhibition can occur independent of HIF activity. ARNT+/+ or ARNT−/− MEFs were treated with 1.5% O2 for 0–20 hr and phosphorylation of p70S6K and rpS6 was examined by Western blot.
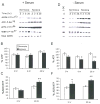
Figure 2. Hypoxia-induced energy starvation and AMPK activation are promoted by growth factor withdrawal
HEK293 cells were exposed to 21% or 1.5% O2 for 0–20 hr in the presence (A–C) or absence (D–F) of 10% serum. (A and D) Hypoxia activates AMPK. Cell extracts were analyzed for AMPK, ACC, eEF2, and 4EBP1 phosphorylation. Levels of total AMPK are shown to assess sample loading. (B–F) Hypoxia modulates cellular ATP and ADP/ATP ratios. Levels of ATP (B and E) and ADP/ATP (C and F) in cell lysates. Total ATP was adjusted to levels of ATP at 0 hr for both normoxic and hypoxic conditions.
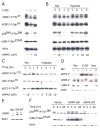
Figure 3. AMPK suppresses mTOR activity under hypoxia
(A–C) Serum-starved HEK293 cells were pretreated with 2 or 10 μM AMPK inhibitor compound C for 30 min before exposure to 2-DG (A), or 21% or 1.5% O2 for 1 or 3 hr (B–C). (D) Serum replete HEK293 cells were preincubated with 10 mM methylpyruvate (MP) for 2 hr prior to 2-DG or 1.5% O2 (20 hr) treatment. Phosphorylation of eEF2, 4EBP1, and rpS6 are indicated. (E–F) Kinase-inactive AMPK α2 mutant suppresses hypoxic mTOR inhibition. HEK293 cells were transfected with empty vector, wild-type AMPK-α2 (AMPK-WT), or kinase inactive K45R mutant (AMPK-DN). Clones expressing similar levels of AMPK protein were selected. (E) Levels of AMPK protein in selected clones. (F) Phosphorylation of p70S6K and rpS6 in cells exposed to 1.5% O2 for 0–20 hr.
Figure 4. TSC2 modulates hypoxic mTOR inhibition
(A) TSC2 null mutation abolishes 2-DG-induced mTOR inhibition. TRKE2 (TSC2+/+), ERC15 (TSC2−/−), and ELT3 (TSC2−/−) cells were treated with LY294002 or 2-DG for 30 min. Phosphorylation of p70 S6K and rpS6 was assessed by Western blot. (B) Hypoxia activates AMPK in TSC2−/− ELT3 cells. Serum-starved ELT3 cells were exposed to 21% or 0.5% O2 for 0.5–48 hr. Levels of AMPK and ACC phosphorylation were examined. (C–F) Serum-starved TRKE2, ERC15, and ELT3 cells were exposed to 21% or 0.5% O2 for 0–20 hr. Cell extracts from normoxic (Nor) and hypoxic (Hyp) conditions were examined for phosphorylation of 4EBP1 (C), p70S6K and rpS6 (D–F).
Figure 5. TSC2 and Rheb modulate hypoxia-induced inhibition of mTOR and protein synthesis
(A–C) TSC2−/− ERC15 cells were stably transected with empty vector (Vec), wild-type (T3 and T21), or N1643K (DN4) TSC2. Clones expressing TSC2 protein at levels similar to TRKE2 cells were selected. *, The asterisk indicates a non-specific polypeptide detected by the anti-TSC2 antibody. (A) Expression of TSC2 protein in selected ERC15 clones. (B) ERC15 clones were examined for phosphorylation of p70S6K and rpS6 after 0.5% O2 treatment and serum deprivation. (C) ERC15 cells were treated with 21% or 0.5% O2 for 48 hr in the presence (Ser+) or absence (Ser−) of 10% serum. *, The asterisk indicates statistically significant difference between Ser+ and Ser− conditions; ◆, The diamond indicates statistically significant differences between normoxic and hypoxic samples. (D) HEK293 cells were transfected with empty vector or Flag-tagged Rheb. Phosphorylation of 4EBP1 and rpS6, and expression of Flag-Rheb were examined during O2 and serum deprivation by Western blot.
Figure 6. TSC2 mutation enhances cell proliferation under low O2 by abolishing hypoxia-induced cell cycle arrest
(A–C) Serum replete TRKE2 and ERC15 cells were exposed to 21% or 0.5% O2 for 24 hr. Cell cycle profile was determined by BrdU/PI staining and analyzed by flow cytometry. (A) Hypoxia suppresses S-phase entry in TSC2+/+ TRKE2 cells. The graph shows the percentages of BrdU+ TRKE2 cells under normoxic and hypoxic conditions. (B) Representative FACS plots for TSC2−/− ERC15 cells transfected with vector (Vec) or wild-type TSC2 (T21). (C) Quantification of BrdU+ cells for ERC15 clones. (D–F) ERC15 cell clones were grown in the presence of 10% FBS under 21 % or 0.5% O2 for 7 days. (D) ERC15 colonies were stained using 0.2% crystal violet. (E) Quantifications of size of ERC15 cells subjected to normoxic (light bars) and hypoxic (dark bars) conditions. Cell size was determined by forward scatter (FSC) for cells in G1 phase of the cell cycle. (F) Representative FACS plots for cell size measurements described in panel E. ERC15 cells (Vec and T3) treated under normoxia (a); Representative plots for Vec (b) and T3 cells (c) under normoxic and hypoxic conditions.
Figure 7. Schematic diagram for the signaling pathways modulated by low O2 that lead to translational inhibition
Hypoxia suppresses signaling for translation initiation, elongation, and ribosome biogenesis via concomitant inhibition of eIF2α eEF2, and mTOR downstream targets 4EBP1, p70S6K, and rpS6. The mTOR regulation involves the AMPK/TSC2/Rheb pathway and is activated by hypoxia-induced decreases in cellular bioenergetics. The eIF2α phosphorylation may be trigged by ER-stress activated PERK and the eEF2 inhibition involves AMPK. HIF-inducible REDD1 has been implicated in the regulation of mTOR upstream of TSC2. Mutations of TSC2 in tumor cells greatly impede hypoxia-induced mTOR inhibition and G1 arrest. Thus, hypoxic translational control may ultimately affect cell growth and proliferation under low O2.
Similar articles
- The tuberous sclerosis protein TSC2 is not required for the regulation of the mammalian target of rapamycin by amino acids and certain cellular stresses.
Smith EM, Finn SG, Tee AR, Browne GJ, Proud CG. Smith EM, et al. J Biol Chem. 2005 May 13;280(19):18717-27. doi: 10.1074/jbc.M414499200. Epub 2005 Mar 16. J Biol Chem. 2005. PMID: 15772076 - Tuberous sclerosis complex gene products, Tuberin and Hamartin, control mTOR signaling by acting as a GTPase-activating protein complex toward Rheb.
Tee AR, Manning BD, Roux PP, Cantley LC, Blenis J. Tee AR, et al. Curr Biol. 2003 Aug 5;13(15):1259-68. doi: 10.1016/s0960-9822(03)00506-2. Curr Biol. 2003. PMID: 12906785 - Molecular mechanisms through which amino acids mediate signaling through the mammalian target of rapamycin.
Kimball SR, Jefferson LS. Kimball SR, et al. Curr Opin Clin Nutr Metab Care. 2004 Jan;7(1):39-44. doi: 10.1097/00075197-200401000-00008. Curr Opin Clin Nutr Metab Care. 2004. PMID: 15090902 Review. - LKB1 and AMP-activated protein kinase control of mTOR signalling and growth.
Shaw RJ. Shaw RJ. Acta Physiol (Oxf). 2009 May;196(1):65-80. doi: 10.1111/j.1748-1716.2009.01972.x. Epub 2009 Feb 19. Acta Physiol (Oxf). 2009. PMID: 19245654 Free PMC article. Review.
Cited by
- FOXO3a involvement in the release of TNF-α stimulated by ATP in spinal cord astrocytes.
Xia M, Zhu Y. Xia M, et al. J Mol Neurosci. 2013 Nov;51(3):792-804. doi: 10.1007/s12031-013-0067-8. Epub 2013 Jul 17. J Mol Neurosci. 2013. PMID: 23860688 - Cancer Plasticity: The Role of mRNA Translation.
Lee LJ, Papadopoli D, Jewer M, Del Rincon S, Topisirovic I, Lawrence MG, Postovit LM. Lee LJ, et al. Trends Cancer. 2021 Feb;7(2):134-145. doi: 10.1016/j.trecan.2020.09.005. Epub 2020 Oct 13. Trends Cancer. 2021. PMID: 33067172 Free PMC article. Review. - Immunobiological factors aggravating the fatty infiltration on tendons and muscles in rotator cuff lesions.
Thankam FG, Dilisio MF, Agrawal DK. Thankam FG, et al. Mol Cell Biochem. 2016 Jun;417(1-2):17-33. doi: 10.1007/s11010-016-2710-5. Epub 2016 May 9. Mol Cell Biochem. 2016. PMID: 27160936 Review. - The mTOR signalling pathway in human cancer.
Pópulo H, Lopes JM, Soares P. Pópulo H, et al. Int J Mol Sci. 2012;13(2):1886-1918. doi: 10.3390/ijms13021886. Epub 2012 Feb 10. Int J Mol Sci. 2012. PMID: 22408430 Free PMC article. Review. - Evidence of Hypoxic Glial Cells in a Model of Ocular Hypertension.
Jassim AH, Inman DM. Jassim AH, et al. Invest Ophthalmol Vis Sci. 2019 Jan 2;60(1):1-15. doi: 10.1167/iovs.18-24977. Invest Ophthalmol Vis Sci. 2019. PMID: 30601926 Free PMC article.
References
- Abraham RT. mTOR as a positive regulator of tumor cell responses to hypoxia. Curr Top Microbiol Immunol. 2004;279:299–319. - PubMed
- Arsham AM, Howell JJ, Simon MC. A novel hypoxia-inducible factor-independent hypoxic response regulating mammalian target of rapamycin and its targets. J Biol Chem. 2003;278:29655–29660. - PubMed
- Browne GJ, Finn SG, Proud CG. Stimulation of the AMP-activated protein kinase leads to activation of eukaryotic elongation factor 2 kinase and to its phosphorylation at a novel site, serine 398. J Biol Chem. 2004;279:12220–12231. - PubMed
Publication types
MeSH terms
Substances
LinkOut - more resources
Full Text Sources
Other Literature Sources
Miscellaneous


