Ciliary beat frequency is maintained at a maximal rate in the small airways of mouse lung slices - PubMed (original) (raw)
Ciliary beat frequency is maintained at a maximal rate in the small airways of mouse lung slices
Philippe Delmotte et al. Am J Respir Cell Mol Biol. 2006 Jul.
Abstract
Ciliary beat frequency (CBF) is a key factor in the defense of the airways, and ATP can stimulate CBF by increasing intracellular calcium concentration ([Ca2+]i). However, the regulatory effects of ATP have been mainly studied in cultured or isolated epithelial cells from the large cartilaginous airways. The aim of this study was to evaluate the regulation of CBF in small airways of lung slices that are representative of in vivo tissue. Mice lungs were inflated with agarose and cut into thin slices with a vibratome. CBF in the small bronchioles was observed with differential interference contrast microscopy and quantified using high-speed digital imaging (at 240 images s(-1)). We found that the in situ organization of the ciliated cells was well preserved and that their CBF was high. We verified the fidelity of our recording system by analyzing rapid changes in CBF in response to temperature. However, we found that ATP had no effect on CBF, despite the fact that the [Ca2+]i, measured with confocal fluorescence imaging, was increased. Ionomycin and purinergic or beta-adrenergic agonists also failed to increase CBF. Similar results were obtained in outgrowths of cells cultured from lung slices. By contrast, ATP increased the slower CBF of outgrowths of ciliated cells cultured from tracheal rings. Therefore, we conclude that CBF in intrapulmonary airways of mice is maintained at a maximum rate and cannot be further increased by agonist stimulation. These conditions would ensure that mucociliary clearance is constantly active to provide continuous airway protection.
Figures
**Figure 1.
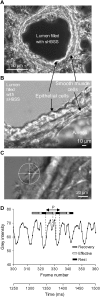
Measurement of CBF in small airways of mice. (A) A low-power phase–contrast image showing a small airway obtained with the lung slice preparation. The lumen is devoid of agarose, but filled with sHBSS. (B) A medium-power image of epithelial cells and SMCs of the small airways and agarose-filled alveoli obtained with DIC microscopy. (C) A high-power DIC image showing two ciliated cells. The cross-hair sight indicates the position of the region of interest used to measure CBF. (D) The waveform of the variation in gray intensity extracted from a 250-ms sequence of digital images (60 frames) recorded at 240 fps. Waveform shows the three phases of the beat cycle: recovery phase, effective phase and rest phase. Each beat cycle period (P; bidirectional arrow) was used to calculate CBF (1/period).
**Figure 2.
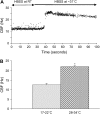
Effect of temperature changes on CBF in ciliated cells of small airways. (A) A representative experiment of a lung slice perfused with sHBSS maintained at RT (∼ 20°C) and with a basal CBF of 12.17 Hz. After 25 s of recording, “warm” sHBSS (∼ 31°C) was perfused which increased the CBF to a maximum value of 26.5 Hz before declining and stabilizing after ∼ 120 s at 23.1 Hz. (B) Summary of the increase in CBF from experiments performed as described in (A). CBF is significantly higher at 28–34°C (21.88 ± 0.66 Hz) than at RT (12.45 ± 0.88 Hz; *P < 0.05; n = 45 cells, 3 mice). (Values are mean ± SEM).
**Figure 3.
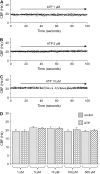
Effect of ATP on CBF in the small airways of mice. (A_–_C) Representative measurements of CBF during 100 s in 3 cells from different lung slices. Application of ATP (A) 1 μM, (B) 5 μM, and (C) 10 μM did not change CBF (temperature 29.6, 31.2, and 30.6°C, respectively). (D) Summary of CBF measurements in response to ATP 1 μM (19.35 ± 0.77 Hz; n = 44 cells, 3 mice), 5 μM (21.04 ± 0.67 Hz; n = 72 cells, 3 mice), 10 μM (21.02 ± 0.82 Hz; n = 112 cells, 4 mice), 100 μM (20.29 ± 1.08 Hz; n = 48 cells, 3 mice), and 500 μM (19.76 ± 0.71 Hz; n = 48 cells, 3 mice) with respect to the control CBF (1 μM ATP 19.30 ± 1.25 Hz; ATP 5 μM, 21.48 ± 0.84 Hz; ATP 10 μM, 21.05 ± 0.97 Hz; ATP 100 μM, 19.33 ± 0.87 Hz) obtained from the first 10 s of recording in the absence of ATP. The temperature during the experiments was between 29.3 and 34°C. (Values are mean ± SEM.)
**Figure 4.
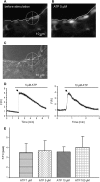
Effect of ATP on Ca2+ signaling in epithelial cells of lung slices. (A and B) Fluorescence images obtained with confocal microscopy and Fluo-3AM. The basal fluorescence was low before addition of ATP (A) and increased with addition of 5 μM ATP (B), indicating an increase in [Ca2+]i. The cross-hair sight indicates the position of the ROI used in this figure. (C) A phase–contrast image showing the localization of ROI on the slice. (D) In the ciliated cell, 5 or 10 μM ATP induced a large and transient increase of fluorescence. Slices were exposed to only one concentration of ATP. The arrow indicates the peak used to compare the maximum levels of fluorescence reached between different experiments. (E) Summary of the increase of the fluorescence ratio (F/F0, peak) after addition of 1, 5, 10, or 100 μM ATP. No significant differences were found between the different concentrations tested. Each concentration was tested at least three times with three different mice.
**Figure 5.
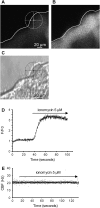
Effect of ionomycin on the [Ca2+]i and CBF of ciliated cells in lung slices. (A) A fluorescence and (C) phase–contrast image showing the basal fluorescence of Fluo-3AM in the epithelial cells, and the position of a selected ROI in a ciliated cell. (B) The increase in fluorescence in the epithelial cells after addition of 5 μM ionomycin. The cross-hair sights indicates the position of the ROI used in this figure. (D) Ionomycin (5 μM) increased the fluorescence ratio (F/F0) in the selected ROI. (E) Representative data showing no change in CBF in a lung slice after addition of 5 μM ionomycin (n = 112 cells, 4 mice).
**Figure 6.
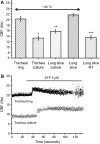
A comparison of the basal CBF and the effects of ATP on CBF in noncultured and cultured lung slices or tracheal rings. (A) The basal CBF of tracheal rings (20.19 ± 0.84 Hz; n = 102 cells, 5 mice) and lung slices (21.65 ± 0.47 Hz; n = 112 cells, 5 mice) are similar, whereas both are significantly higher than the basal CBF of cultured outgrowths from tracheal rings (*13.23 ± 0.72 Hz; n = 56 cells, 6 mice; P < 0.05) or lung slices (**15.73 ± 0.70 Hz; n = 112 cells, 7 mice; P < 0.05). CBF measured at RT in lung slices is significantly lower (***13.52 ± 0.70 Hz; n = 188 cells, 5 mice; P < 0.05) than CBF measured at ∼ 30°C. (B) ATP (5 μM) induced a similar increase in CBF in both tracheal rings (45 ± 3%; n = 64 cells, 5 mice) and tracheal cultures (51 ± 5%; n = 22 cells, 6 mice). However, CBF decreased gradually in tracheal rings to reach the prestimulatory basal rate after ∼ 2 min, while CBF was sustained in tracheal cultures. (Values are mean ± SEM.)
Similar articles
- ATP regulation of ciliary beat frequency in rat tracheal and distal airway epithelium.
Hayashi T, Kawakami M, Sasaki S, Katsumata T, Mori H, Yoshida H, Nakahari T. Hayashi T, et al. Exp Physiol. 2005 Jul;90(4):535-44. doi: 10.1113/expphysiol.2004.028746. Epub 2005 Mar 15. Exp Physiol. 2005. PMID: 15769883 - Mucociliary function in the mouse measured in explanted lung tissue.
Kurosawa H, Wang CG, Dandurand RJ, King M, Eidelman DH. Kurosawa H, et al. J Appl Physiol (1985). 1995 Jul;79(1):41-6. doi: 10.1152/jappl.1995.79.1.41. J Appl Physiol (1985). 1995. PMID: 7559244 - Intracellular calcium oscillations regulate ciliary beat frequency of airway epithelial cells.
Evans JH, Sanderson MJ. Evans JH, et al. Cell Calcium. 1999 Sep-Oct;26(3-4):103-10. doi: 10.1054/ceca.1999.0060. Cell Calcium. 1999. PMID: 10598274 - Different cilia response to adenosine triphosphate or benzalkonium chloride treatment in mouse nasal and tracheal culture.
Jiao J, Wang H, Meng N, Zhang L. Jiao J, et al. ORL J Otorhinolaryngol Relat Spec. 2012;74(5):280-5. doi: 10.1159/000343800. Epub 2012 Nov 13. ORL J Otorhinolaryngol Relat Spec. 2012. PMID: 23154526 - Ciliary beat co-ordination by calcium.
Schmid A, Salathe M. Schmid A, et al. Biol Cell. 2011 Apr;103(4):159-69. doi: 10.1042/BC20100120. Biol Cell. 2011. PMID: 21401526 Review.
Cited by
- Co-exposure to cigarette smoke and alcohol decreases airway epithelial cell cilia beating in a protein kinase Cε-dependent manner.
Wyatt TA, Sisson JH, Allen-Gipson DS, McCaskill ML, Boten JA, DeVasure JM, Bailey KL, Poole JA. Wyatt TA, et al. Am J Pathol. 2012 Aug;181(2):431-40. doi: 10.1016/j.ajpath.2012.04.022. Epub 2012 Jun 5. Am J Pathol. 2012. PMID: 22677421 Free PMC article. - Effects of Extracts and Flavonoids from Drosera rotundifolia L. on Ciliary Beat Frequency and Murine Airway Smooth Muscle.
Hake A, Begrow F, Spiegler V, Symma N, Hensel A, Düfer M. Hake A, et al. Molecules. 2022 Oct 5;27(19):6622. doi: 10.3390/molecules27196622. Molecules. 2022. PMID: 36235159 Free PMC article. - Carbocisteine stimulated an increase in ciliary bend angle via a decrease in [Cl-]i in mouse airway cilia.
Ikeuchi Y, Kogiso H, Hosogi S, Tanaka S, Shimamoto C, Matsumura H, Inui T, Marunaka Y, Nakahari T. Ikeuchi Y, et al. Pflugers Arch. 2019 Feb;471(2):365-380. doi: 10.1007/s00424-018-2212-2. Epub 2018 Oct 6. Pflugers Arch. 2019. PMID: 30291431 - CRACking the Beat of Cilia: Calcium Rocks.
Wittekindt OH. Wittekindt OH. Am J Respir Cell Mol Biol. 2019 Oct;61(4):410-411. doi: 10.1165/rcmb.2019-0072ED. Am J Respir Cell Mol Biol. 2019. PMID: 30990760 Free PMC article. No abstract available. - Seihai-to (TJ-90)-Induced Activation of Airway Ciliary Beatings of Mice: Ca2+ Modulation of cAMP-Stimulated Ciliary Beatings via PDE1.
Kogiso H, Ikeuchi Y, Sumiya M, Hosogi S, Tanaka S, Shimamoto C, Inui T, Marunaka Y, Nakahari T. Kogiso H, et al. Int J Mol Sci. 2018 Feb 26;19(3):658. doi: 10.3390/ijms19030658. Int J Mol Sci. 2018. PMID: 29495403 Free PMC article.
References
- Joki S, Toskala E, Saano V, Nuutinen J. Correlation between ciliary beat frequency and the structure of ciliated epithelia in pathologic human nasal mucosa. Laryngoscope 1998;108:426–430. - PubMed
- Lucas A, Douglas L. Principles underlying ciliary activity in the respiratory tract. Acta Otolaryngol 1934;20:518.
- Toskala E, Nuutinen J, Rautiainen M, Torkkeli T. The correlation of mucociliary transport and scanning electron microscopy of nasal mucosa. Acta Otolaryngol 1995;115:61–65. - PubMed
- Pack RJ, Al-Ugaily LH, Morris G, Widdicombe JG. The distribution and structure of cells in the tracheal epithelium of the mouse. Cell Tissue Res 1980;208:65–84. - PubMed
Publication types
MeSH terms
Substances
LinkOut - more resources
Full Text Sources
Miscellaneous
