Immature monocytes acquire antigens from other cells in the bone marrow and present them to T cells after maturing in the periphery - PubMed (original) (raw)
Immature monocytes acquire antigens from other cells in the bone marrow and present them to T cells after maturing in the periphery
Frank Tacke et al. J Exp Med. 2006.
Abstract
Monocytes are circulating precursors for tissue macrophages and dendritic cells (DCs) but are not recognized to directly participate in antigen presentation. We developed techniques to label mouse monocyte subsets with particulate tracers in vivo. Gr-1lo but not Gr-1hi monocytes were stably labeled by intravenous injection of 0.5-microm microspheres. Gr-1hi monocytes could be labeled when the microspheres were injected after systemic depletion of blood monocytes and spleen macrophages. In this condition, the phagocytic tracer was transferred to immature bone marrow monocytes by neutrophils and B cells that first carried the particles to the bone marrow. Moreover, antigens from B cells or proteins conjugated to the tracer particles were processed for presentation by monocytes and could induce T cell responses in the periphery. Cell-associated antigen taken up by bone marrow monocytes was retained intracellularly for presentation of the antigen days later when monocyte-derived DCs migrated to lymph nodes or in vitro after differentiation with granulocyte/macrophage colony-stimulating factor. These data reveal that immature monocytes unexpectedly sample antigen from the bone marrow environment and that they can present these antigens after they leave the bone marrow.
Figures
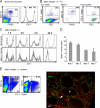
Figure 1.
Labeling of Gr-1lo monocytes by i.v. LX particles. (A) Monocytes were identified as low SSC CD115+ F4/80+ live cells, and subsets were defined by surface Gr-1 levels (lo, low; int, intermediate; hi, high). (B) Blood analysis 4 h after i.v. LX bead injection. Gates on total live cells, LX+ cells, or monocytes are shown. Data are representative of >20 experiments. (C) Short-term time course of the Gr-1 phenotype of LX+ monocytes (monos) or all monocytes after i.v. administration of LX beads in the blood (n = 6 at each time point). (D) LX labeling efficiency of Gr-1lo monocytes expressed as the percentage of all monocytes. Data are the means ± SEM (error bars) of >10 animals per time point. (E) Analysis of spleen after i.v. injection of LX particles. FACS analysis 4 h after LX injection identifies most LX+ cells in the spleen as B220+CD19+ B cells and fewer CD11bhi macrophages. (right) Sections of spleen 1 d after i.v. LX administration stained for CD11b (red) show LX beads (green) in the marginal zone (arrow) but not in white pulp (asterisk). Bar, 100 μm.
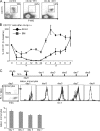
Figure 2.
Labeling of Gr-1hi monocytes by i.v. clodronate liposomes followed by LX particle injection. (A) Flow cytometric evaluation of blood monocytes. By 18 h after i.v. injection of CLLs (clo-lip), >95% of all blood monocytes are depleted from the circulation. 1 d later (42 h after clo-lip), monocytes reappear in the blood (right plot). (B) Flow cytometric evaluation monitored the presence of monocytes in blood and bone marrow at various time points after CLLs were injected i.v. The line graph illustrates the degree of depletion in blood and bone marrow through 8 d. Results are expressed as the percent frequency of monocytes ± SEM (error bars) compared with their starting baselines in blood and bone marrow (BM). (C) Injection schedule for the labeling of Gr-1hi monocytes in circulation is depicted. The labeling of returning blood monocytes with LX at day 1 is shown (dot plot). Histograms reveal the intensity of Gr-1 on the LX+ returning monocytes, and the bar graph indicates the LX labeling efficiency of Gr-1hi blood monocytes (mean ± SEM). More than eight animals were examined and showed similar results per time point; individual animals are shown.
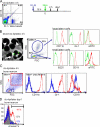
Figure 3.
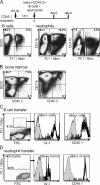
Labeling of blood B cells and neutrophils during monocyte depletion. (A) The injection scheme, as depicted, was to administer CLLs and, 18 h later, when monocytes were depleted, to inject LX beads i.v. The blood was examined for LX+ cells 4 h thereafter. LX+ cells at this time point were CD115− cells. (B) The LX+ CD115− blood cells during monocyte depletion (4 h after LX administration; see injection scheme in A) was comprised of two populations: small lymphocytes (arrowheads in cytospin) that stain positive for B220, CD19, and anti-FITC and large neutrophils (arrow in cytospin) that stain positive for CD11b and Gr-1 and negative for anti-FITC. Red lines in each profile reveal staining for these molecules; green lines reveal staining with isotype-matched control mAbs. Data are representative of at least six mice analyzed individually per condition. (C) The bone marrow in mice subjected to the injection scheme in A and examined 4 h after LX was administered i.v. shows populations with similar profiles as in the blood. Gates of LX+ cells in bone marrow reveal small cells with low SSC (gated blue in the FSC/SSC plot) and larger cells with high side scatter (gated red in the FSC/SSC plot). Histograms show staining patterns of these populations in the same color as the corresponding gate. (D) The occurrence of apoptotic cells in the bone marrow was monitored by annexin V staining in mice injected with CLLs followed by LX particles (as per the injection scheme in A). The bone marrow was examined 1 d after LX beads were administered i.v. The gray histogram represents gates on all cells, the blue line represents gating on small LX+ cells (B cells; blue gate in C), and the red line represents gating on large LX+ cells (neutrophils; red gate in C). Percentage of annexin V–positive cells (bar) is shown.
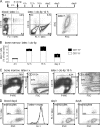
Figure 4.
Mobilization of LX+ neutrophils and B cells from the spleen to the bone marrow leads to robust monocyte labeling. (A) LX beads were injected i.v. Then, 8 h later, some mice received CLLs i.v. (middle dot plot). The blood was analyzed 12 h later, 20 h after the administration of LX beads, and at several time points thereafter. At the 12-h time point, most LX+ cells seen in the group of mice receiving CLLs were CD115− cells with the high FSC/SSC profile of neutrophils (middle and right dot plots). A comparison with mice receiving no liposomes, only LX i.v., is shown in the left dot plot. (B) A time course depicts the fraction of LX+ cells among total bone marrow cells that were CD115− (mostly neutrophils and B cells) and CD115+Gr-1hi monocytes from 4 h to 2 d after the administration of CLL. Error bars represent SEM. (C) Bone marrow was analyzed 16 h after liposome administration. Monocytes were identified by double staining for F4/80 and CD115, and the degree to which this population was LX+ was assessed (right plots). Comparison was made with mice that received only LX beads without CLL (left plots). (D) Analysis of the monocyte population in blood at day 2 or later after CLLs were administered. All data are representative of more than six mice per condition.
Figure 5.
Adoptive transfer of LX+ CD45.2+ B cells and neutrophils into CD45.1+ recipient mice. (A) For the isolation of B cells for adoptive transfer, donor mice were treated first with CLL and then with LX beads i.v as described in Materials and methods. B220+ cells were positively selected using magnetic cell sorting beads, and 15–20% of these B cells were LX+. Cells enriched with LX+ neutrophils (CD11b+ CD115− cells with high SSC) were prepared by incubating total bone marrow cells ex vivo with LX beads. A minor population (<3% of total cells) of this cell preparation were LX+ monocytes, shown by CD115 staining (right plot). (B) Bone marrow was analyzed 2 d after adoptive transfer, when blood monocytes were beginning to return. CD45.2+ transferred cells were present when either labeled B cells (left) or neutrophils (right) were transferred. (C and D) In the circulation of recipient mice that received adoptively transferred LX+ B cells (C) or cell preparations enriched in neutrophils (D) 18 h after the administration of CLL, CD115+ monocytes were observed that became LX+ (left), were Gr-1hi (black lines, middle; gray line identifies Gr-1lo control staining), and were CD45.1+ (right, black lines; gray lines represent negative control staining). The intensity of Gr-1 staining on Gr-1hi cells varies from C because of the use of a different anti–Gr-1 conjugate. In each experimental design, at least six mice were recipients of adoptively transferred cells (three experiments conducted in duplicate), and each showed similar outcomes.
Figure 6.
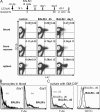
Effect of B cell deficiency and PT on the transfer of LX to bone marrow monocytes. (A) C57BL/6 WT (white bars) and B cell–deficient μMT mice (black bars) were treated i.v. with LX particles followed by CLLs as diagramed in the schematic. The percentage of CD115+ monocytes that were LX+ in bone marrow and blood is depicted. Results are expressed as means ± SEM (error bars); differences between WT and μMT mice at most time points are significant (*, P < 0.05 using a t test). (B) LX beads were administered to mice, and mice received CLL i.v. 8 h later along with PT or PBS. Bone marrow was examined at 16 h to assess the impact of PT treatment on the acquisition of LX by monocytes. Data are representative of three mice in each condition, all with similar outcomes. (C) Mice received PT or PBS i.v. followed by LX beads i.v. 2 h later, and bone marrow was examined after 24 h for LX particle uptake by monocytes. Data shown are representative of three mice in each condition, all with similar outcomes.
Figure 7.
Antigen presentation of cellular proteins from transferred allogeneic B cells to monocytes. (A) I-Ad+ B cells were isolated from spleen and lymph nodes of BALB/c mice and injected i.v. into monocyte-depleted C57BL/6 mice 18 h after treatment with CLLs as shown in the schematic. Monocyte-depleted mice that did not receive BALB/c B cells served as controls. The presence of I-Ad+ B cells was analyzed in blood, bone marrow, and spleen 4 h and 1 d after B cell transfer. Cells with a low FSC/SSC profile were gated to focus analysis on lymphocytes, and the percentage of CD19+IAd+ lymphocytes was determined. Each plot shows the mean + SD of at least three mice studied per condition. (B) Histograms show Y-Ae expression on blood monocytes at days 1 and 3 (gray histogram, controls; black line, BALB/c B cell transfer). Six animals per condition were studied in three independent experiments. (C) Whole blood cells were prepared 3 d after BALB/c cell transfer i.v., and washed leukocytes were cultured for 2 d in the presence of GM-CSF to promote the differentiation of monocytes toward a DC phenotype. Y-Ae (left) and CD11c (right) expression by monocytes was examined after BALB/c B cell transfer before (dark gray line) and after (black line) culture; gray histogram, control monocytes from mice not receiving transferred B cells after 2 d of culture (no).
Figure 8.
Antigen presentation by Gr-1hi– and Gr-1lo–labeled monocytes and induction of T cell proliferation in vivo. (A) CD4+ OT-II cells pooled from spleen and lymph nodes by positive selection for CD4 expression were labeled with CFSE and injected into CLL-treated C57BL/6 wt mice (left) or B cell–deficient μMT mice (right) that had also received either plain (not conjugated) LX beads or OVA-conjugated LX beads. (B) A similar experimental design was performed except that mice were not treated with CLL, such that Gr-1lo monocytes became LX+. (A and B) These data are representative of three experiments with two mice per group. (C) OVA-LX–labeled monocytes (splenic DCs were positive controls) were isolated from bone marrow and injected intradermally into the back skin and front footpad of MHC-II−/− mice, which had received CFSE-labeled OT-II cells. Proliferation of CFSE-labeled OT-II cells was assessed at day 6. A gate was drawn around CFSE-labeled T cells in each mouse. The number accompanying the left side of the box indicates percent proliferated CFSE-labeled T cells; the number marking the right side of the box indicates the fraction of CFSE-labeled T cells that did not proliferate.
Similar articles
- Dendritic cell differentiation potential of mouse monocytes: monocytes represent immediate precursors of CD8- and CD8+ splenic dendritic cells.
León B, Martínez del Hoyo G, Parrillas V, Vargas HH, Sánchez-Mateos P, Longo N, López-Bravo M, Ardavín C. León B, et al. Blood. 2004 Apr 1;103(7):2668-76. doi: 10.1182/blood-2003-01-0286. Epub 2003 Nov 20. Blood. 2004. PMID: 14630812 - Hyaluronan Binding Identifies a Functionally Distinct Alveolar Macrophage-like Population in Bone Marrow-Derived Dendritic Cell Cultures.
Poon GF, Dong Y, Marshall KC, Arif A, Deeg CM, Dosanjh M, Johnson P. Poon GF, et al. J Immunol. 2015 Jul 15;195(2):632-42. doi: 10.4049/jimmunol.1402506. Epub 2015 Jun 17. J Immunol. 2015. PMID: 26085682 - Role of CCR8 and other chemokine pathways in the migration of monocyte-derived dendritic cells to lymph nodes.
Qu C, Edwards EW, Tacke F, Angeli V, Llodrá J, Sanchez-Schmitz G, Garin A, Haque NS, Peters W, van Rooijen N, Sanchez-Torres C, Bromberg J, Charo IF, Jung S, Lira SA, Randolph GJ. Qu C, et al. J Exp Med. 2004 Nov 15;200(10):1231-41. doi: 10.1084/jem.20032152. Epub 2004 Nov 8. J Exp Med. 2004. PMID: 15534368 Free PMC article. - Migratory fate and differentiation of blood monocyte subsets.
Tacke F, Randolph GJ. Tacke F, et al. Immunobiology. 2006;211(6-8):609-18. doi: 10.1016/j.imbio.2006.05.025. Epub 2006 Jul 10. Immunobiology. 2006. PMID: 16920499 Review. - Antigen presentation by monocytes and monocyte-derived cells.
Randolph GJ, Jakubzick C, Qu C. Randolph GJ, et al. Curr Opin Immunol. 2008 Feb;20(1):52-60. doi: 10.1016/j.coi.2007.10.010. Epub 2007 Dec 21. Curr Opin Immunol. 2008. PMID: 18160272 Free PMC article. Review.
Cited by
- RBP-J regulates homeostasis and function of circulating Ly6Clo monocytes.
Kou T, Kang L, Zhang B, Li J, Zhao B, Zeng W, Hu X. Kou T, et al. Elife. 2024 Feb 26;12:RP88135. doi: 10.7554/eLife.88135. Elife. 2024. PMID: 38407952 Free PMC article. - The role of antigen-presenting cells in triggering graft-versus-host disease and graft-versus-leukemia.
Chakraverty R, Sykes M. Chakraverty R, et al. Blood. 2007 Jul 1;110(1):9-17. doi: 10.1182/blood-2006-12-022038. Epub 2007 Feb 27. Blood. 2007. PMID: 17327406 Free PMC article. - Inflammatory monocytes recruited after skeletal muscle injury switch into antiinflammatory macrophages to support myogenesis.
Arnold L, Henry A, Poron F, Baba-Amer Y, van Rooijen N, Plonquet A, Gherardi RK, Chazaud B. Arnold L, et al. J Exp Med. 2007 May 14;204(5):1057-69. doi: 10.1084/jem.20070075. Epub 2007 May 7. J Exp Med. 2007. PMID: 17485518 Free PMC article. - Distinct infiltration of neutrophils in lesion shoulders in ApoE-/- mice.
Rotzius P, Thams S, Soehnlein O, Kenne E, Tseng CN, Björkström NK, Malmberg KJ, Lindbom L, Eriksson EE. Rotzius P, et al. Am J Pathol. 2010 Jul;177(1):493-500. doi: 10.2353/ajpath.2010.090480. Epub 2010 May 14. Am J Pathol. 2010. PMID: 20472897 Free PMC article. - Weathering the Storm: Harnessing the Resolution of Inflammation to Limit COVID-19 Pathogenesis.
Silberberg E, Filep JG, Ariel A. Silberberg E, et al. Front Immunol. 2022 May 9;13:863449. doi: 10.3389/fimmu.2022.863449. eCollection 2022. Front Immunol. 2022. PMID: 35615359 Free PMC article. Review.
References
- Gordon, S. 1986. Biology of the macrophage. J. Cell Sci. Suppl. 4:267–286. - PubMed
- Ziegler-Heitbrock, H.W. 1989. The biology of the monocyte system. Eur. J. Cell Biol. 49:1–12. - PubMed
- Imhof, B.A., and M. Aurrand-Lions. 2004. Adhesion mechanisms regulating the migration of monocytes. Nat. Rev. Immunol. 4:432–444. - PubMed
- Leon, B., M. Lopez-Bravo, and C. Ardavin. 2005. Monocyte-derived dendritic cells. Semin. Immunol. 17:313–318. - PubMed
Publication types
MeSH terms
Substances
LinkOut - more resources
Full Text Sources
Other Literature Sources
